Figure 8.
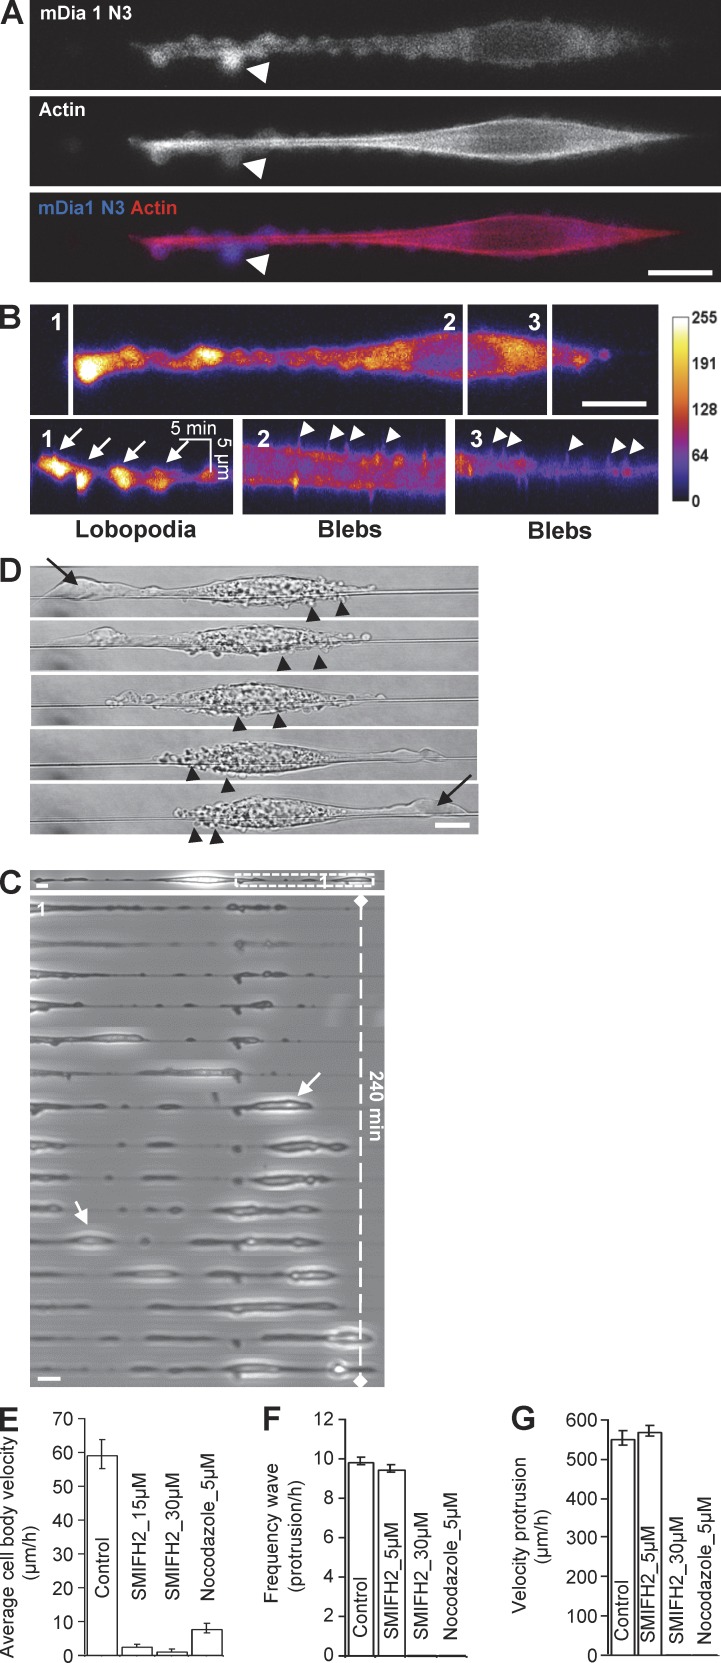
Alternative mode of protrusions is explained by lobopodia formation. (A) 3T3 cell transfected with GFP-mDia1 ΔN3 (dominant positive) and RFP-Actin. Lobopodia (arrows) are at the leading edge, and the trailing edge presented strong blebbing. Bar, 10 µm. (B) 3 kymographs of mDia1 ΔN3 intensity map. 1, lobopodia slow dynamic (arrows); 2 and 3, blebs fast dynamic (arrowheads). (C) An image and a zoomed time sequence of a Nocodazole-treated 3T3 cell plated on fiber. Increasing contractility led to the formation of large structures resembling lobopodia (arrows). Bars, 10 µm. (D) 3T3 cell transfected with GFP-Talin and RFP-Paxilin (see also Video 9) showing shifting polarity of a large lobopodia (arrow) and the mirror changes for the blebbing region (arrowheads). Bar, 10 µm. (E) Quantification of the mean linear speed for cells. Error bar, SEM from a typical experiment; NB, 33 (control), 27 and 31 (SMIFH2), 30 (nocodazole). (F) Frequency of protrusions (NB, 13 [control] 6 [SMIFH2], 6 [nocodazole]). (G) Velocity of protrusions (NB, 39 [control], 41 [SMIFH2]), under different conditions.

