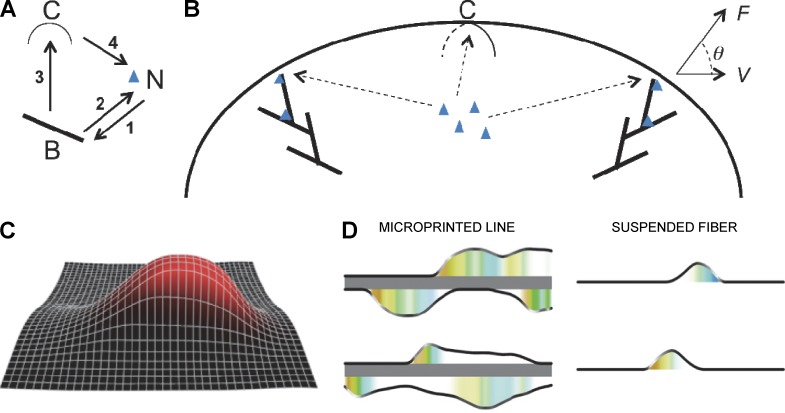
Figure 9.
Computational model of actin protrusive array. (A) Positive feedbacks in the model: (1) actin filament branching (stick, B) needs NPFs (blue chevron, N); (2) NPF binding needs barbed ends; (3) actin pushing increases the membrane curvature (arc, C); (4) NPFs are attracted to the regions of higher membrane curvature. (B) Protrusive actin arrays impinge on the membrane at various angles (q) and generate force (F). The membrane ridge travels with velocity V of the order of actin polymerization rate. The arrays compete for the common pools of NPFs in the cytoplasm. (C) Model predicts that the membrane deforms in a ridge-like shape; barbed end density is shown in red. (D) The left/right column depicts simulated protrusion on microprinted line/fiber; upper and lower rows show snapshots from two different time points. (right) On fiber, the traveling wave of actin organized in a fin-like protrusion evolves. The black curve shows the outline of the actin ridge, white/gray shading indicates the NPF density at the leading edge. The colored shading below the membrane protrusion encodes the orientation of the local dominating actin array (warm colors, barbed ends grow to the left; cold colors, to the right). (left) as at the right but the parameters characterizing the total NPF amount and membrane tension are increased.

