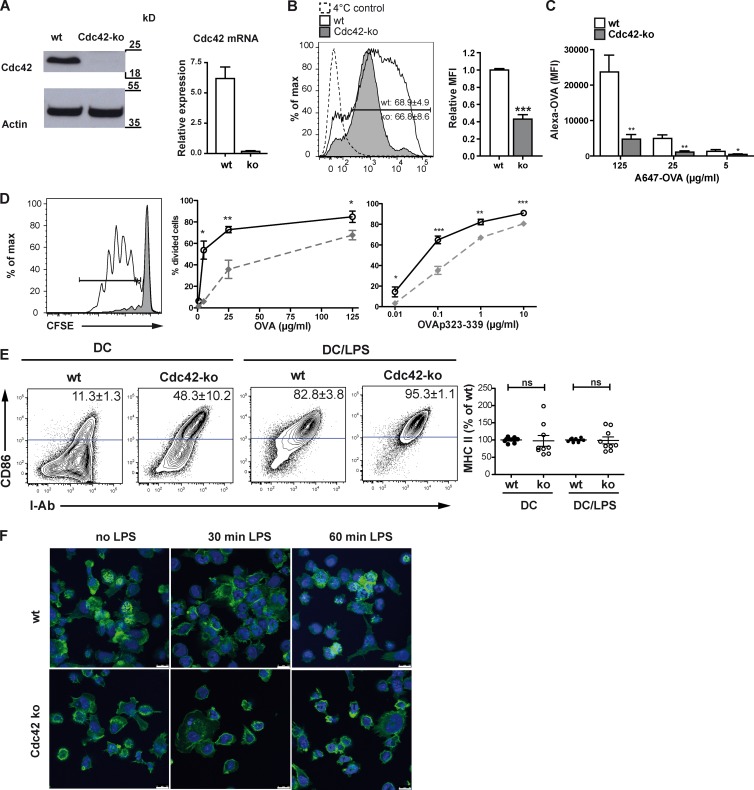
Figure 1.
Cdc42 is required for Ag uptake and subsequent Ag presentation to CD4 T cells. (A) Cdc42 protein and mRNA are absent in Cdc42 ko BMDCs as shown by Western blotting and qPCR. Bar graph shows one representative experiment out of three with two biological replicates. (B) BMDCs were pulsed with Alexa OVA, and uptake was determined by flow cytometry. Uptake of Ag was quantified by comparing the mean fluorescence intensity (MFI) values of wt versus Cdc42 ko BMDCs. Bar graph shows pooled data from three independent experiments. (C) To evaluate a concentration-dependent effect on Ag uptake, Alexa OVA was added to BMDC cultures at different concentrations for 12 h. Cells were harvested and analyzed by flow cytometry. The bar graph shows MFI values from one experiment. n = 3. (D) BMDCs were pulsed with peptide-free OVA or OVA323–339 and then co-cultured with OVA-specific CFSE-labeled OT-II T cells at the indicated concentrations. After 4 d, T cell proliferation was determined as CFSE dilution. Graphs show the percentage of divided T cells of one representative experiment. n = 3. (E) BMDC surface marker expression was determined by flow cytometry gating on CD11c+ cells using antibodies for I-Ab and CD86. MFI of MHCII expression was calculated as the percentage of MHCII MFI from wt control BMDCs. Data from three different experiments with similar outcomes were pooled (n = 8–9). (F) BMDCs were seeded on fibronectin-coated slides for 30 min (no LPS) and thereafter treated with 10 ng/ml LPS for 30 or 60 min. Phalloidin–Alexa Fluor 488 (green) reveals podosomes as punctate actin-rich structures in wt DCs (no LPS). As a nuclear stain, Draq5 (blue) was used. Error bars represent mean ± SEM. ns, not significant. Bars, 10 µm. *, P < 0.05; **, P < 0.01; ***, P < 0.001.

