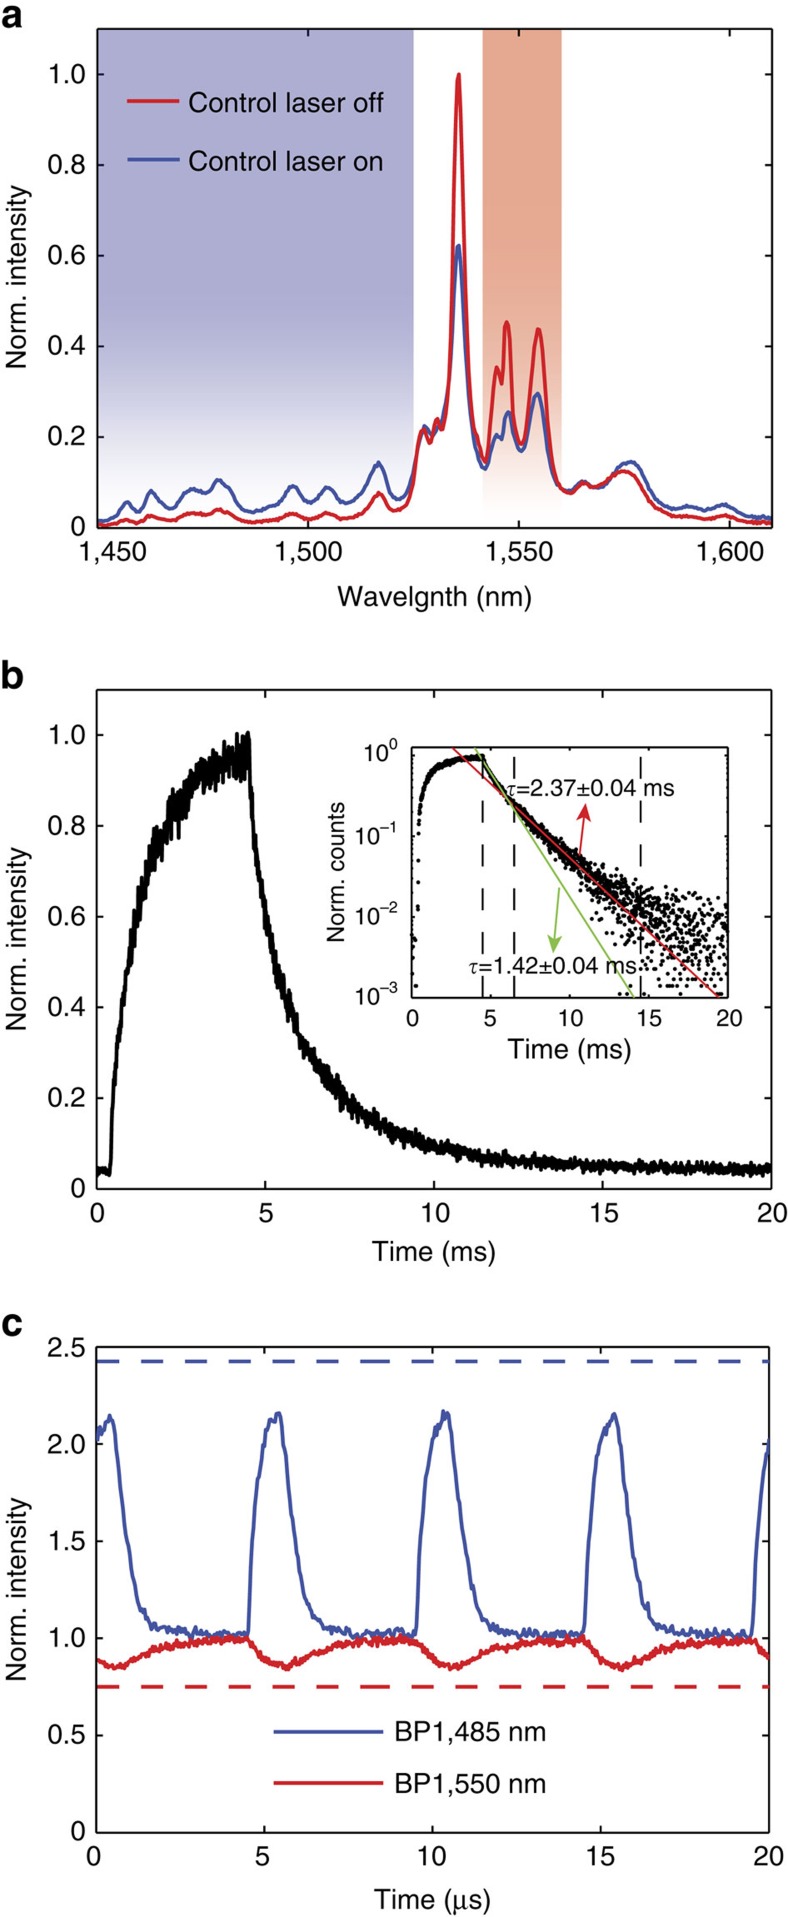
Figure 4. Sub-lifetime modulation of Er3+ light emission.
(a) Experimental spectra for Er3+ ions when VO2 is in the insulating state (red) and in the metallic state (blue). (b) Decay trace of the time-resolved photoluminescence intensity from Er3+ ions subjected to a pulsed 532 nm excitation. Inset shows lifetime fits, showing both fast (green) and slow (red) decay contributions with lifetimes of  and
and  , respectively. (c) Time-resolved normalized photoluminescence of the Er3+ ions in the multilayer structure when continuously pumped by a 532-nm laser while VO2 is simultaneously switched by a pulsed 1,064 nm excitation at a 200 kHz repetition rate. Note the three orders of magnitude difference in the time-scale for c as compared with b. Blue and red solid lines represent two different spectral ranges of the bandpass (BP) filters (1,450–1,520 nm and 1,538–1,562 nm, respectively). The dashed lines show the theoretical maximum modulation calculated according to the spectra in a.

