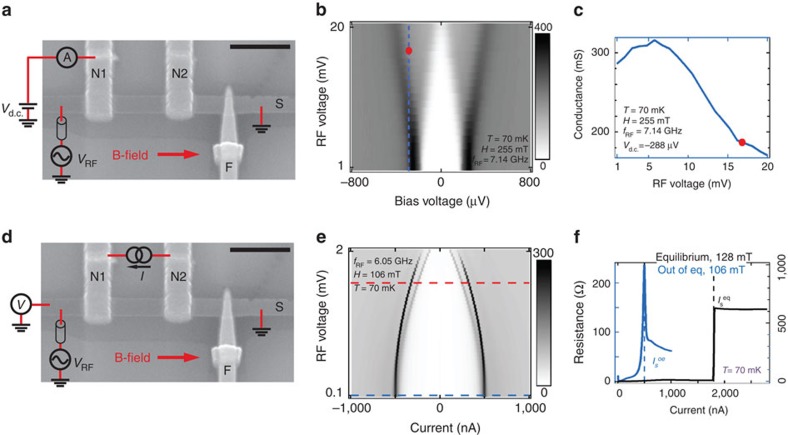
Figure 1. Two on-chip microwave power detection schemes for superconducting (hybrid) devices.
(a,c) Scanning electron micrograph of a device nominally identical to Device A (scale bar, 1 μm) and schematic drawings of the two measurement set-ups. (Data shown are from Device A unless otherwise stated.) In both cases, a static magnetic field, H is applied parallel to a superconducting bar (S, Al) and a sinusoidal signal of root mean squared amplitude VRF and frequency fRF in the microwave range applied across the length of S (with a lossy coaxial cable in series), resulting in a high-frequency field perpendicular to H. To detect the spin precession of the quasiparticles in S, two on-chip detection methods are used. (a) Detection scheme 1: a voltage Vd.c. is applied between S and a normal electrode (N1, thick Al) with which it is in contact via an insulating tunnel barrier (I, Al2O3). The differential conductance G=dI/dVd.c. is measured, where I is the current between N1 and S. (b) G as a function of Vd.c. and nominal VRF (at the output of the generator and not accounting for attenuation in the lines). The red dot indicates the operation point of the detector for the data in Fig. 2:  , Vd.c.=−288 μV. For any given frequency, we define
  as the VRF (at the output of the generator) at which the effective voltage at the device is the same as that for fRF=7.14 GHz and VRF=16.81 mV. (See Supplementary Note 2 and Supplementary Fig. 2). (c) A slice of b at Vd.c.=−288 μV (blue dashed line in b) with the operation point indicated. (d) Detection scheme 2: a current Id.c. is injected along the length of S. We measure either the voltage V between the ends of the S bar or the differential resistance R=dV/dId.c.. We record in particular the switching current IS at which S first becomes resistive. (e) R as a function of Id.c. and nominal VRF (not accounting for attenuation in the lines). The switching current IS at which S become resistive appears here as a peak in R. IS can be seen to decrease monotonically with VRF. The red dashed line indicates the operation point of the detector for the data in Fig. 3: VRF=0.8
 . (f) The blue trace is the first slice of e (blue dashed line in e) at VRF=0.1 mV. The black trace is a two terminal measurement of the S bar, in the absence of microwaves, with a constant corresponding to the resistance of the lines subtracted. The difference in IS between the two indicates that the S bar is strongly out of equilibrium in our second (switching current) detection scheme. (See Supplementary Note 4).

