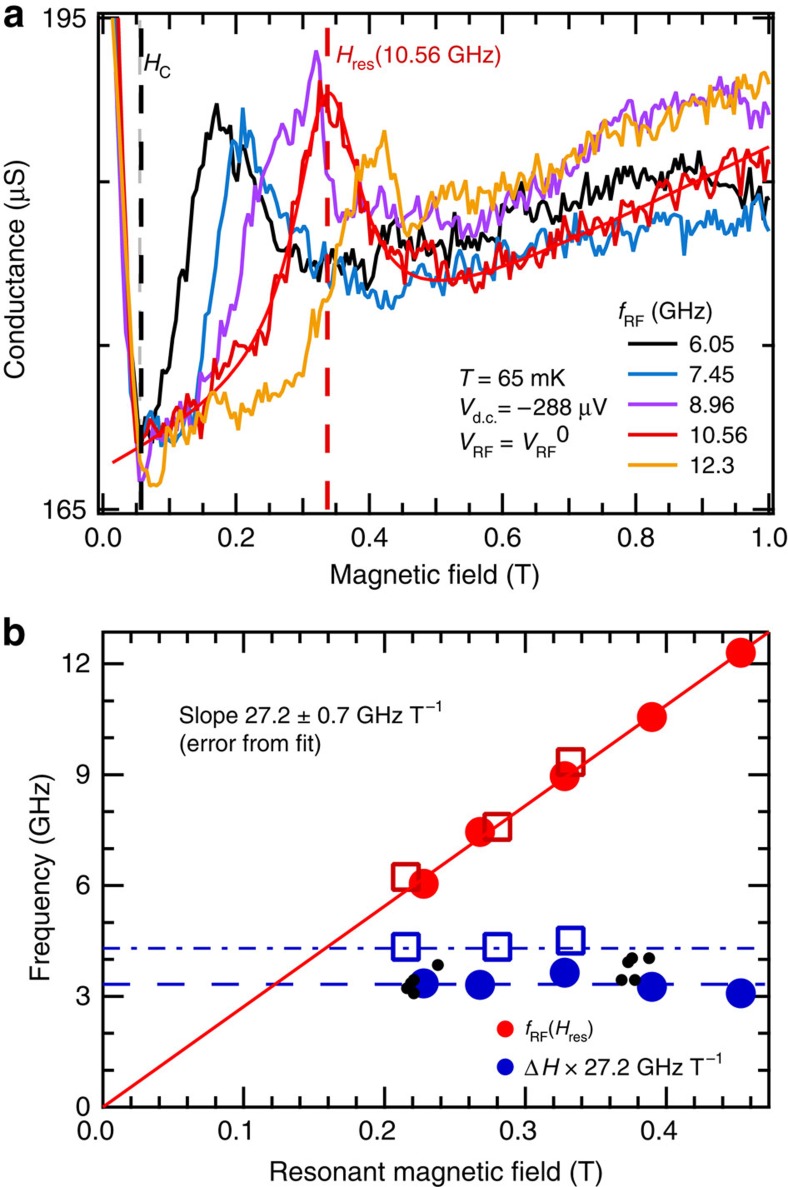
Figure 2. Spin resonance in conductance across tunnel junction.
(a) NIS junction conductance G as a function of H at Vd.c.=−288 μV and  for different fRF. The black vertical line indicates the critical field of N. Hres and ΔH are obtained for each fRF by fitting a Lorentzian with a linear background. The fit for fRF=10.56 GHz is shown (thin red line) and Hres indicated with a red vertical line. (b) Hres and ΔH the resonance linewidth (full width at half maximum) as a function of fRF (red and blue circles, respectively). A linear fit to Hres(fRF) data gives a Landé g-factor of 1.95±0.2. The black dots indicate values obtained at different powers or with the second detection scheme. (See Supplementary Note 3 and Supplementary Fig. 3). All dots and circles have been offset by 53 mT to account for a systematic shift in the applied magnetic field during the associated cooldown. The squares indicate values obtained from Device B, in which S is 6-nm thick.

