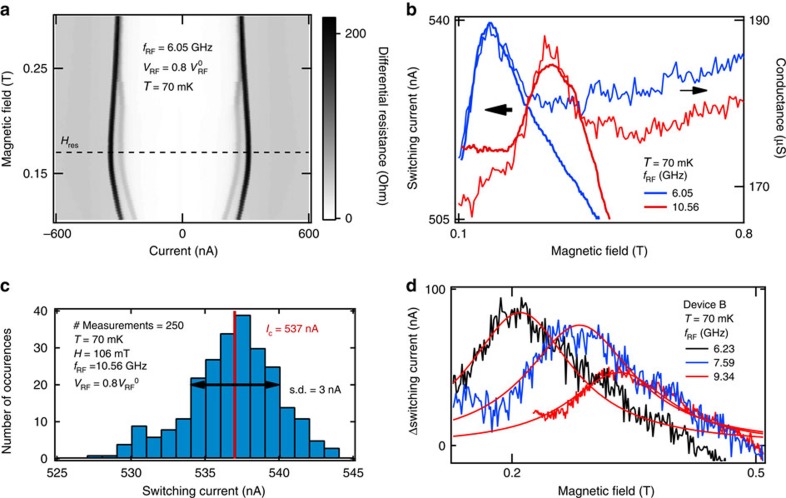
Figure 3. Spin resonance in supercurrent, comparison of detection schemes.
(a) Differential resistance R of the S bar as a function of H and Id.c. with fRF=6.05 GHz, VRF=0.8  . At Hres∼0.17 T, the resonant field, the switching current IS can be seen to increase, indicating that less microwave power is being transmitted to the superconducting condensate as more power is absorbed by the quasiparticles in S. (b) Switching current IS as a function of static magnetic field H for two different fRF. (Here a slight change was made to the measurement circuit: With reference to Fig. 1d, the current is applied between N2 and F instead of between N1 and N2, hence the slightly higher IS: the current injection electrodes are closer together.) Superimposed on these traces are the conductance traces from Fig. 2a at the same fields. Hres and ΔH can be seen to be similar for both measurement methods. The bold red trace has been offset downwards by 19 nA. (c) The switching currents in b are averages of ∼200 measurements, with a s.d. of ∼3 nA. Here we show a histogram of 250 switching currents corresponding to the first point in the bold red trace in b. Current was driven long the length of the S bar and the voltage measured between N1 and N2. (Voltage and current leads are thus switched with respect to b). (d) Device B: switching current IS as a function of static magnetic field H for three different fRF, with a linear background subtracted (thick lines). Hres and ΔH obtained from the fits (thin red lines) are shown in Fig. 2b. These IS values are averages of ∼500 measurements.

