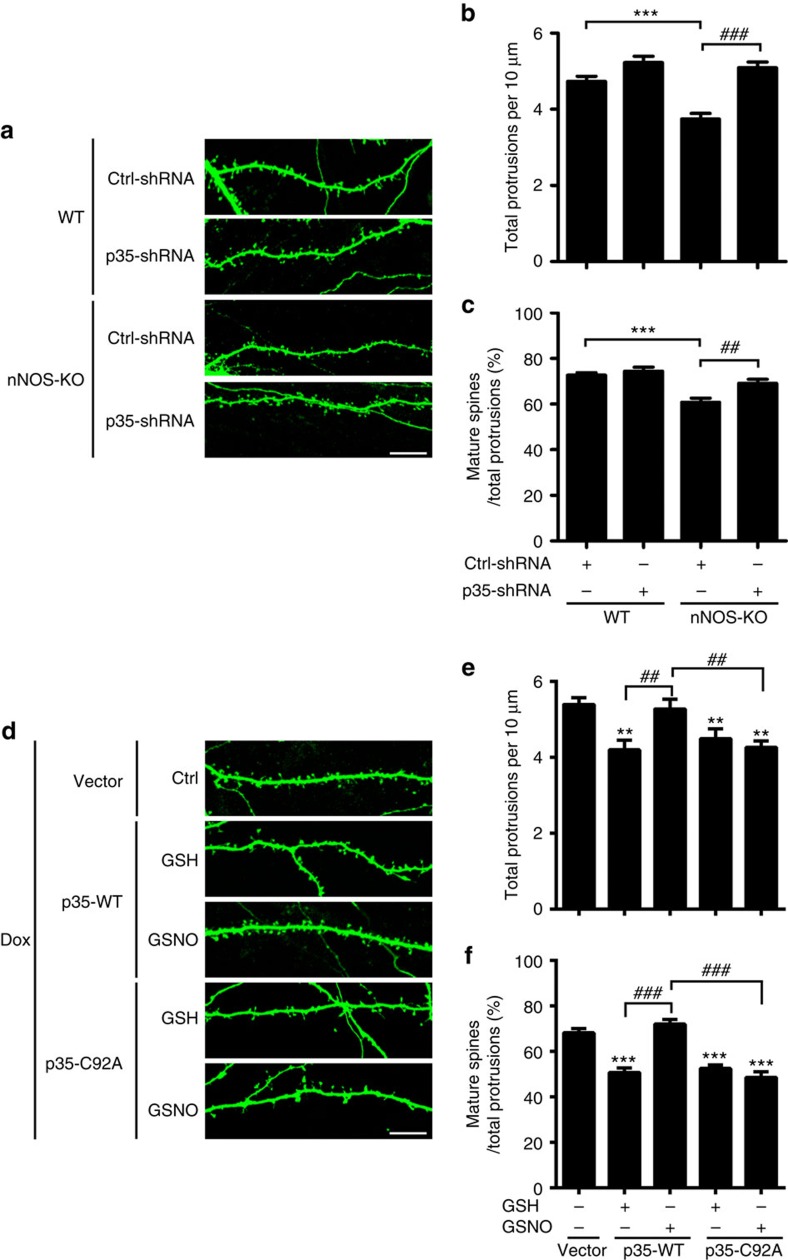
Figure 5. NO signalling regulates spine density and morphology via p35 S-nitrosylation at Cys92 and downregulation of Cdk5 activity.
(a–c) NO signalling regulated spine density and morphology in a p35-dependent manner. Hippocampal neurons derived from WT or nNOS-knockout (KO) mice were transfected with control (Ctrl)-shRNA or p35-shRNA together with a GFP construct at 12–13 days in vitro and fixed at 20 days in vitro. Representative images (a) are shown. Scale bar, 10 μm. Quantification of spine density (b) and percentages of mature spines (c). Data represent the mean±s.e.m. of four independent experiments; n=24–30 dendrites from 10–15 neurons. Total protrusions: ***P=6.03E−6, ###P=2.68E−8; mature spine proportion: ***P=2.39E−6, ##P=0.002; one-way analysis of variance (ANOVA) with the Student–Newman–Keuls test. (d–f) S-nitrosylation of p35 at Cys92 regulated spine density and morphology. Cultured rat hippocampal neurons at 15–16 days in vitro (DIV) were transfected with a cDNA construct encoding p35-WT or p35-C92A using an inducible TetOFF system; neurons at 20–22 DIV were then treated with GSH/GSNO (50 μM) for 8 h in the presence of doxycycline (Dox). (d) Representative images are shown. Scale bar, 10 μm. Quantification of spine density (e) and percentages of mature spines (f). Data represent the mean±s.e.m. of four independent experiments; n=15–21 dendrites from 8–10 neurons. Total protrusions: **P=0.0037 (p35-WT+GSH), **P=0.0065 (p35-C92A+GSH), **P=0.0058 (p35-C92A+GSNO), ##P=0.0045 (p35-WT+GSH versus p35-WT+GSNO), ##P=0.0024 (p35-WT+GSNO versus p35-C92A+GSNO); mature spine proportion: ***P=4.56E−7 (p35-WT+GSH), ***P=8.81E−7 (p35-C92A+GSH), ***P=3.14E−7 (p35-C92A+GSNO), ###P=5.59E−9 (p35-WT+GSH versus p35-WT+GSNO), ###P=6.33E−9 (p35-WT+GSNO versus p35-C92A+GSNO); one-way ANOVA with the Student–Newman–Keuls test.

