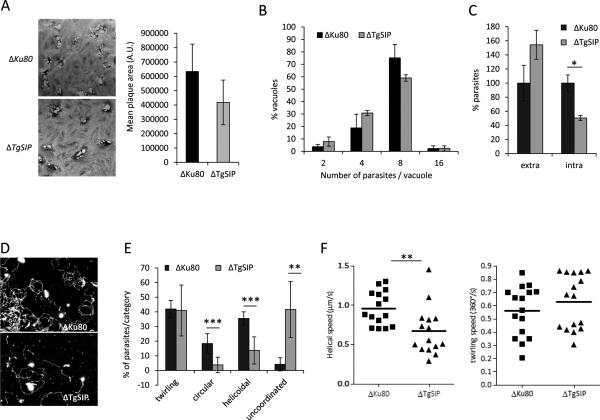
Figure 5. Loss of TgSIP affects parasite motility and host cell invasion.
A. Plaque formation of indicated parasites was analyzed after 7 days. Plaques represent areas where host cells have been lysed and are visible as oval white spots on the background HFF staining. Quantification of the size of the lysis plaques is shown in the graph. The size difference between control (ΔKu80) and ΔTgSIP is not statistically significant.
B. Intracellular growth of Δku80 and ΔTgSIP parasites assessed by counting the number of parasites per vacuole. Only vacuoles containing at least two parasites were counted. Values represent means ± SEM, n = 3, from a representative experiment out of 3 independent assays. No significant difference was found.
C. Host cell invasion assay. Control and ΔTgSIP parasites were allowed to invade for 5 min before fixation and differential staining of attached extracellular and intracellular parasites. Results were normalized to ΔKu80. Values represent means ± SEM, n = 3, from a representative experiment out of 3 independent assays. Student's t test *p < 0.05.
D. Trail deposition staining after gliding of control (ΔKu80) and ΔTgSIP parasites. Parasites were allowed to glide on polyL-lysine coated coverslips for 15 min after induction with 1 μM of calcium ionophore A23187, and trails were stained with anti-SAG1 antibody. Scale bars in red represent 2 μm.
E. Quantification of parasite motility by time-lapse video microscopy. The types of motility were categorized in four groups, including the three well-described circular, helicoidal and twirling movements. A fourth group of unconventional movements highly represented in ΔTgSIP was added (see Materials and Methods). Data are plotted as a percentage of the total movement observed. Values represent mean ± s.e.m, n = 7, from 3 independent assays. Student's t test **p < 0.01, ***p < 0.001.
F. Effect of TgSIP suppression on the speed of gliding. Scatter plots depicting the speeds of helical (left) and twirling (right) gliding motility in ΔKu80 and ΔTgSIP parasites. The gliding speeds (μm/s for helical and 360°/s for twirling) were calculated from following the movements of at least 15 parasites for each strain. Bars represent median values. Student's t test **p < 0.01.

