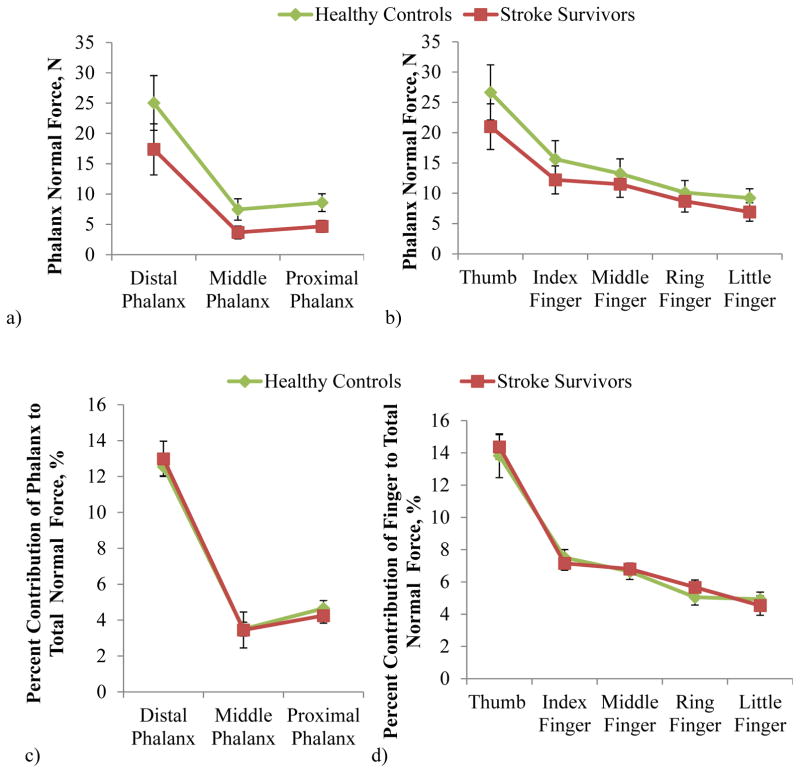
Figure 5.
The distribution of phalanx normal force across the phalanges (a and c) and fingers (b and d) for stroke and control subjects. Percent contribution (c and d) of the individual phalanges to total normal force was not significantly dependent upon the interaction of subject group and phalanx or the interaction of subject group and finger (ANOVA with p>.05) (d). Non-transformed mean ± SE data is shown in the figure.

