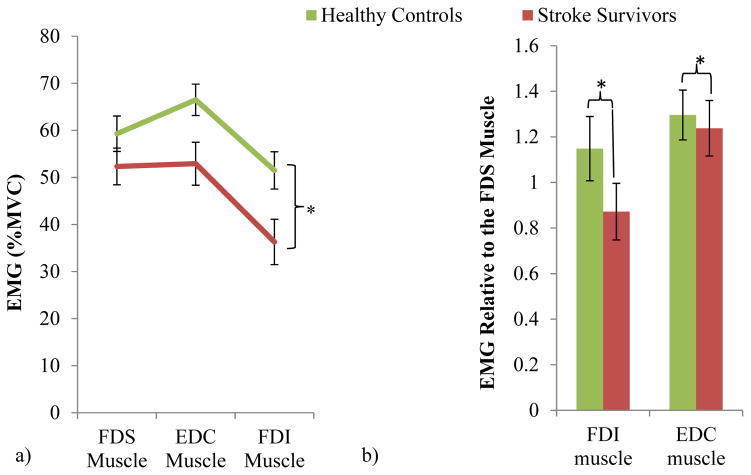
Figure 6.
Mean ± SE EMG was significantly reduced for all muscles of the stroke survivors compared with healthy controls (a). Relative to the FDS EMG, mean ± SE FDI and EDC EMG were significantly reduced for stroke survivors compared with controls (significant subject group and finger muscle interaction with p<.05, significant difference in relative FDI and EDC EMG between stroke and control with Tukey post-hoc p<.05) (b), showing an altered muscle activity pattern with a particularly underactivated intrinsic FDI muscle and the extrinsic EDC muscle for stroke survivors compared with controls. Non-transformed data is shown in the figure.

