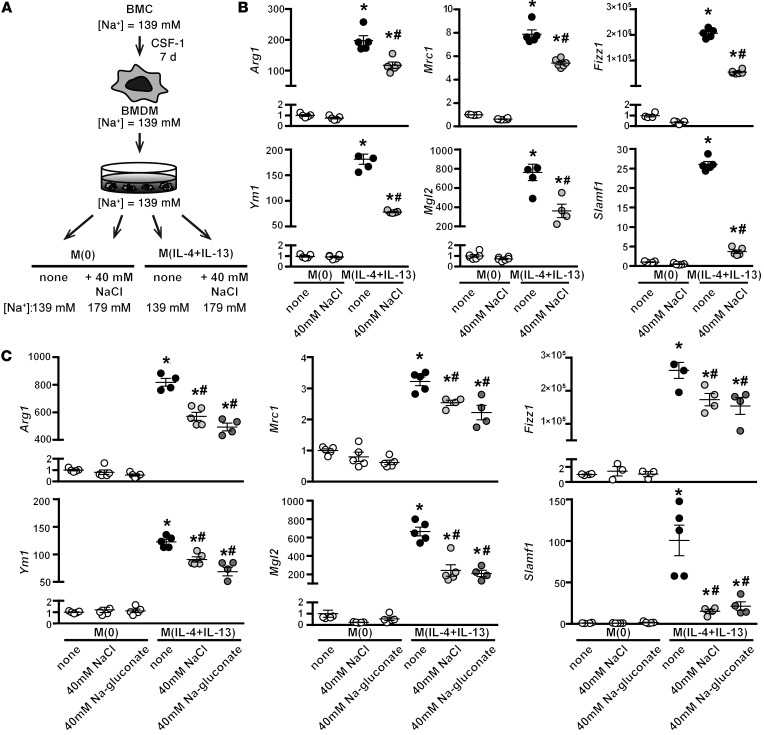
Figure 1. High salt blunts the expression of M(IL-4+IL-13) signature genes.
(A) Schematic of in vitro stimulation of macrophages. Indicated is the final media concentration of Na+ per condition, where 139 mM is normal, isotonic media. BMC, BM cells. (B) Macrophages were stimulated with IL-4 and IL-13 (M[IL-4+IL-13]) in the absence (none) or with an additional 40 mM NaCl for 24 hours. Unstimulated (M[0]) macrophages were treated similarly. The expression of M(IL-4+IL-13) signature genes was determined by qPCR. The experiment was repeated at least 3 times independently. n = 6 (technical). *P < 0.05 vs. M(0) and #P < 0.05 vs. M(IL-4+IL-13) none by 1-way ANOVA. (C) Macrophages were stimulated with IL-4 and IL-13 as in B or with an additional 40 mM Na-gluconate for 24 hours, and signature gene expression was analyzed by qPCR. The experiment was repeated at least 3 times independently. n = 5 (technical). *P < 0.0001 vs. M(0); #P < 0.001 vs. M(IL-4+IL-13) none by 1-way ANOVA.

