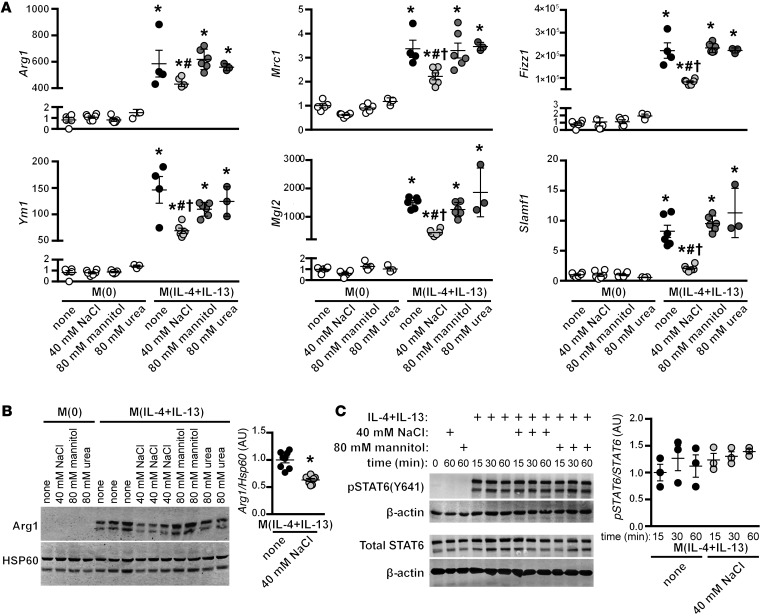
Figure 2. Effect of NaCl on M(IL-4+IL-13) activation is not related to changes in tonicity.
(A) Macrophages were stimulated with IL-4 and IL-13 in the absence (none) or with an additional 40 mM NaCl, or 80 mM urea or mannitol, as tonicity controls. Signature gene expression was analyzed by qPCR. The experiment was repeated at least 3 times independently. n = 6 (technical). *P < 0.0001 vs. M(0); #P < 0.05 vs. M(IL-4+IL-13) none and M(IL-4+IL-13) + mannitol; and †P < 0.01 vs. M(IL-4+IL-13) + urea by 1-way ANOVA. (B) Protein levels of ARG1 were determined by Western blotting after treatment, as in A. HSP60 loading control is also shown. Dot plots shows the quantification of the relative levels of ARG1 normalized to M(IL-4+IL-13) lysates, with n = 2–3 technical replicates and the pooling of 3 independent experiments (total n = 8). *P < 0.0001 (t test). (C) The effect of NaCl on the phosphorylation of STAT6 was determined by Western blotting. Macrophages were serum-starved overnight and then pretreated for 5 minutes with an additional 40 mM NaCl or 80 mM mannitol, prior to stimulation with IL-4+IL-13 for 15, 30, or 60 minutes. The levels of phosphorylated and total STAT6 were determined in separate blots, with β-actin used as loading control. The dot plot shows the quantification of relative levels of pSTAT6/STAT6 for each time point, normalized to t = 15 minutes of M(IL-4+IL-13) lysates, from the pooling of 2 independent experiments (n = 3 technical replicates).

