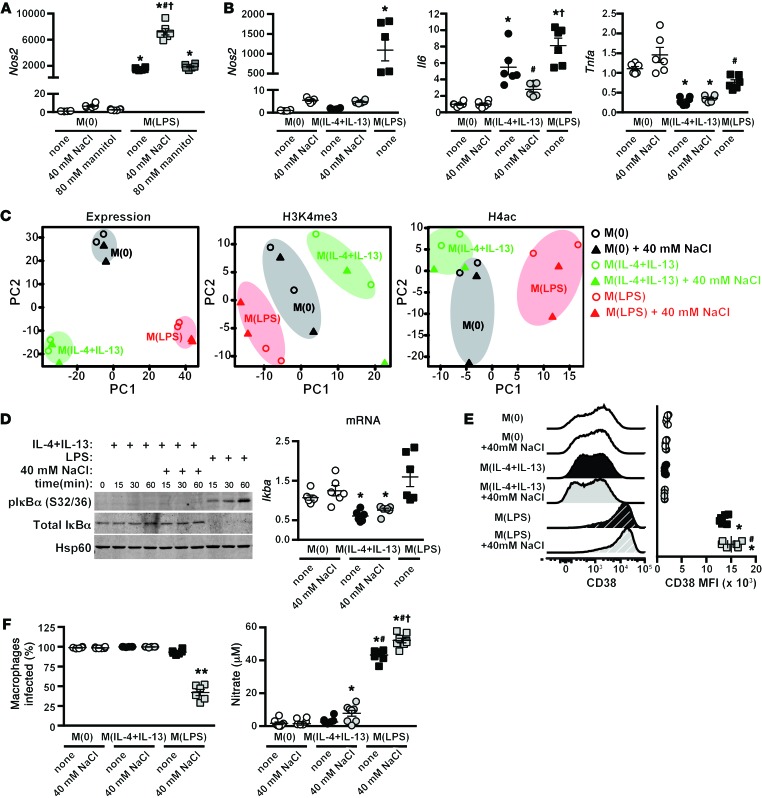
Figure 3. Salt does not induce an M1 phenotype in M(IL-4+IL-13)-activated macrophages.
(A) BMDM were stimulated with LPS — M(LPS) — in the absence (none) or presence of an additional 40 mM NaCl or 80 mM mannitol for 24 hours. The expression of Nos2 was determined by qPCR. n = 6 (technical). *P < 0.001 vs. M(0); #P < 0.001 vs. M(LPS) none; and †P < 0.001 vs. M(LPS) + 80 mM mannitol. (B) Macrophages were activated to M(0), M(IL-4+IL-13), or M(LPS) as in A. Nos2, Il6, and Tnfa gene expression was determined by qPCR. n = 6 (technical). *P < 0.001 vs. M(0); #P < 0.05 vs. M(IL-4+IL-13) none; and †P < 0.05 vs. M(IL-4+IL-13) none and M(IL-4+IL-13) + 40 mM NaCl. (C) Macrophages were activated to M(0), M(IL-4+IL-13), or M(LPS) as in A, and genome-wide gene expression was determined by microarray. ChIP-seq was performed for H3K4me3 and H4ac chromatin modifications. Principle component (PC) analysis was performed on all genes in 2 independent, biological replicates. (D) Left: Macrophages were pretreated with an additional 40 mM NaCl and then stimulated with IL-4+IL-13 or LPS for 15, 30, or 60 min. The levels of phosphorylated and total IκBα were determined by Western blotting, with Hsp60 as control. Right: The expression of Ikba by qPCR. n = 6 (technical). *P < 0.01 vs. M(LPS). (E) CD38 surface expression as mean fluorescence intensity (MFI) by flow cytometry in macrophages activated to M(0), M(IL-4+IL-13), or M(LPS) alone (none) as in A. n = 2 technical replicates and the pooling of 3 independent experiments (total n = 6). *P < 0.01 vs. M(0) none, M(0) + 40 mM NaCl, M(IL-4+IL-13) none, and M(IL-4+IL-13) + 40 mM NaCl; and #P < 0.05 vs. M(LPS). (F) Left: The percentage of BMDM infected with Leishmania major after 72 hours. Right: Nitrate levels. The experiment was repeated independently 3 times and then pooled. n = 8–10 (technical). *P < 0.05 vs. M(0) none, M(0) + 40 mM NaCl, and M(IL-4+IL-13) none; **P < 0.01 vs. all other groups; #P < 0.0001 vs. M(IL-4+IL-13) + 40 mM NaCl; and †P < 0.001 vs. M(LPS) none. Statistics in A, B, and D–F were analyzed by 1-way ANOVA.

