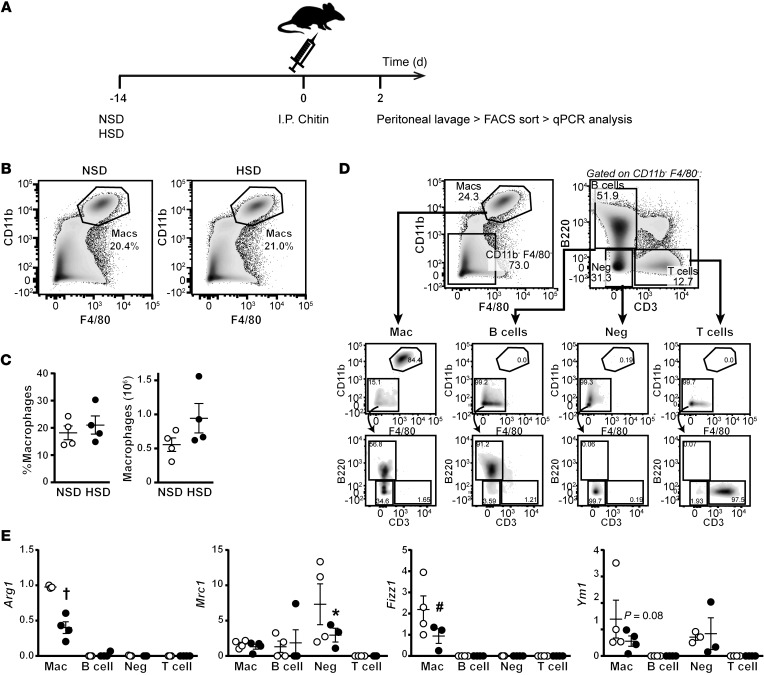
Figure 5. HSD reduces M2 activation in vivo.
(A) Mice were fed an NSD or an HSD for 14 days, at which point chitin was injected i.p. After 2 days, PECs were collected from the i.p. space by lavage and the desired immune populations were sorted by FACS and analyzed by qPCR. (B) Representative flow cytometry plots showing staining for macrophages (CD11b+F4/80+) of PECs from mice on NSD and HSD. (C) Quantification from B of the proportion and actual number of macrophages in PECs from mice on each respective diet. n = 4 (biological). (D) Gating strategy for the isolation of the desired immune populations by FACS. Following the gating of macrophages (Mac; CD11b+F4/80+) cells were then gated on CD11b–F4/80– and subsequently sorted as B220+ (B cells), CD3+ (T cells), or B220–CD3– (Neg). The final purity of each sorted population is shown below, where macrophages were >85% and all other populations were >90%. (E) The expression of M2 signature genes in immune cell populations sorted from PECs as described in D. (n = 4 NSD vs. n = 4 HSD biological replicates). *P < 0.05, #P < 0.01, and †P < 0.0001 by 2-way ANOVA.

