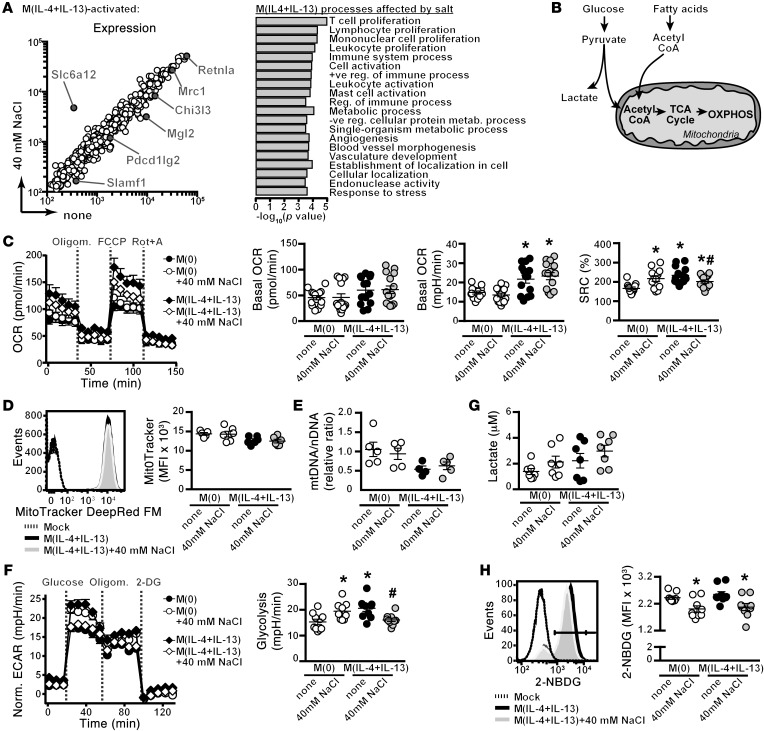
Figure 8. Salt modulates M(IL-4+IL-13) cellular metabolism.
(A) Macrophages were activated to M(IL-4+IL-13) ± high salt for 24 hours as before, and gene expression was analyzed by microarray. M(IL-4+IL-13) signature genes from Figure 1 and Slc6a12 are indicated. Salt-modulated M(IL-4+IL-13) genes were subjected to GO analysis (right). The top 20 GO terms (FDR < 0.065) are shown. (B) Schematic of the major cellular metabolic pathways: glycolysis and OXPHOS. (C) OCR of unstimulated (M[0]) or M(IL-4+IL-13)-activated macrophages without (none) or with high salt for 24 hours, followed by sequential treatment with Oligomycin (to inhibit mitochondrial respiration), FCCP (to elucidate maximal respiration), and rotenone plus antimycin A (Rot+A) (to measure nonmitochondrial respiration). Also basal OCR, basal ECAR, and SRC in 3 independent experiments were pooled (total n = 14). *P < 0.05 vs. M(0) and #P < 0.05 vs. M(IL-4+IL-13). (D) Mitochondrial mass by staining cells with MitoTracker red and flow cytometry. n = 6 (2 independent experiments pooled). (E) Mitochondrial content was measured by the ratio of mitochondrial (mt) DNA to nuclear (N) DNA. n = 5 (technical). (F) ECAR of M(0) or M(IL-4+IL-13) activated as in C, followed by sequential treatment with glucose (to initiate glycolysis), Oligomycin, and 2-deoxy glucose (DG) (to inhibit glycolysis). The rate of glycolysis was calculated based on the difference between basal ECAR and the maximal ECAR, following glucose stimulation. Two independent experiments were pooled (total n = 10). *P < 0.05 vs. M(0) and #P < 0.05 vs. M(IL-4+IL-13). (G) One-hour lactate production from supernatants by fluorometric assay. Two independent experiments were pooled (total n = 7). (H) Glucose uptake of macrophages activated as indicated for 24 hours, followed by incubation of the cells with 2NB-DG for 1 hour and analysis by flow cytometry. Three independent experiments were pooled (total n = 9). *P < 0.05 vs. M(0) none. Statistics in C, F, and H) were analyzed by 1-way ANOVA.

