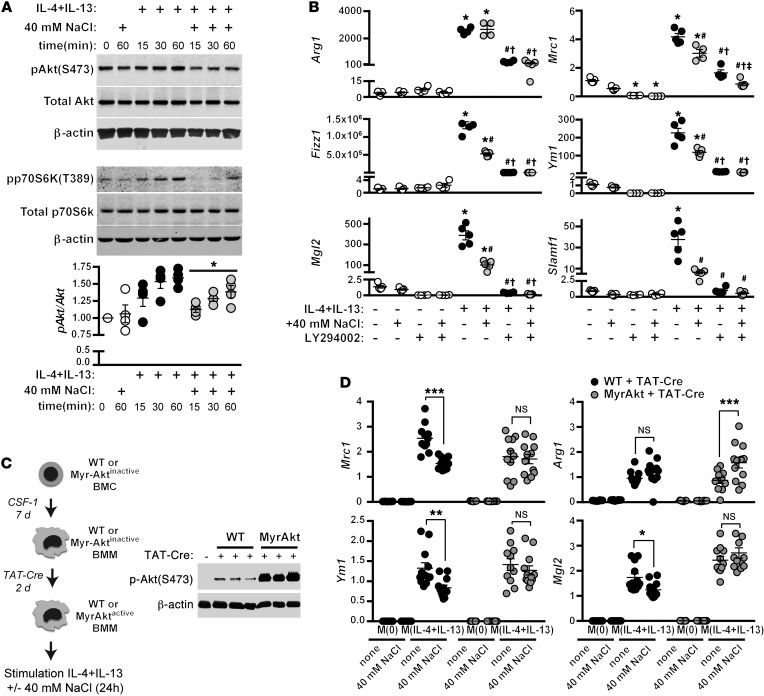
Figure 9. High NaCl blunts the induction of AKT and mTOR signaling.
(A) The effect of NaCl on AKT phosphorylation was determined by Western blotting. Macrophages were serum-starved overnight and then pretreated with 40 mM NaCl for 5 minutes, prior to stimulation with IL-4+IL-13 for 15, 30, or 60 minutes. The levels of total AKT were determined in a separate blot, with β-actin as a loading control. Also shown is phospho-p70S6K. Quantification of phospho-AKT/total AKT levels, normalized to t = 0, was obtained by pooling the mean levels from 3 independent experiments (total n = 4). *P < 0.05 vs. M(IL-4+IL-13) none by 2-way ANOVA. (B) Macrophages were stimulated with IL-4 and IL-13 in the absence (none) or with an additional 40 mM NaCl, or with an AKT inhibitor (LY294002, 50 μM) for 24 hours, and signature gene expression was analyzed by qPCR. n = 5 (technical). *P < 0.05 vs. M(0) none and M(0) + 40 mM NaCl; #P < 0.001 vs. M(IL-4+IL-13) none; †P < 0.001 vs. M(IL-4+IL-13) + 40 mM NaCl; and ‡P < 0.05 vs. M(IL-4+IL-13) + LY294002 none by 1-way ANOVA. (C) Schematic for the generation of BMDM with constitutively active Akt (NH[2]-terminally myristoylation signal-attached AKT; MyrAkt). Western blot (right) shows a robust induction of phosphorylated AKT after treatment of BMDM MyrAkt macrophages with TAT-Cre for 2 days. BMDM from WT macrophages treated with TAT-Cre similarly are shown. (D) BMDM from WT and MyrAkt mice were treated with TAT-Cre as in C and then stimulated with IL-4 and IL-13 in the absence (none) or with an additional 40 mM NaCl for 24 hours, and signature gene expression was analyzed by qPCR. Two independent stimulations were performed, which were then pooled (total n = 10–12 technical). *P < 0.05; **P < 0.01; and ***P < 0.001 by 2-way ANOVA.

