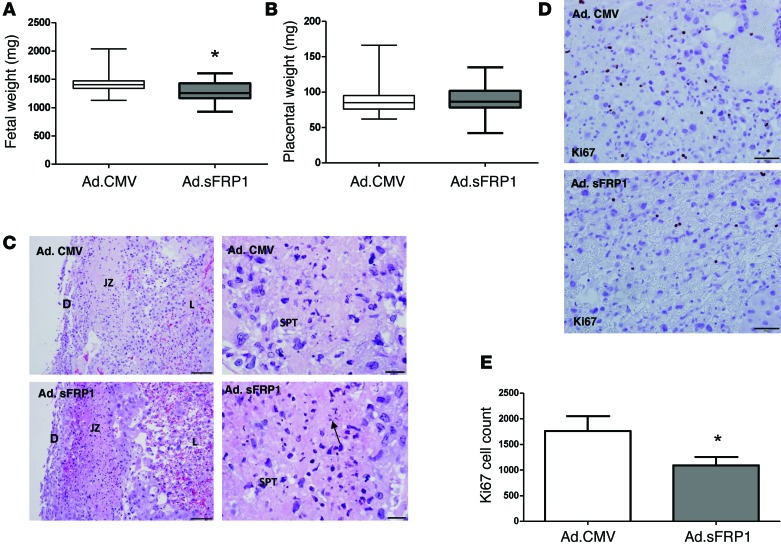
Figure 2. Exogenous sFRP1 leads to FGR, trophoblast karyorrhexis, and decreased proliferation.
(A) Fetal weights in CD1 pregnant mice injected on E15 with an adenovirus expressing sFRP1 (n = 9 litters, 120 fetuses) as compared with those injected with control virus (n = 7 litters, 77 fetuses). Data are presented as a box plot (25th–75th percentile), with horizontal bars representing median values and whiskers representing minimum and maximum values (*P < 0.001 versus control virus treated animals by t test). (B) Placental weights of CD1 pregnant mice shown in A. Data are presented as a box plot (25th–75th percentile), with horizontal bars representing median values and whiskers representing minimum and maximum values. (C) Representative images illustrating increased spongiotrophoblast karyorrhexis in the placentas of the sFRP1 virus–treated mice (n = 3) compared with control mice (n = 3). The arrow indicates karyorrhexis in the junctional zone. D, decidua; JZ, junctional zone; SPT, spongiotrophoblast; L, labyrinth. Scale bar: 100 μm (left column); 20 μm (right column). (D) Representative histology sections of the murine placentas demonstrate reduced Ki67 immunostaining, a marker of proliferation, in the sFRP1 virus–treated animals (n = 3) compared with the control virus–treated animals (n = 3) at E19. Scale bar: 50 μm. (E) Quantification of Ki67 staining by ImageJ for the data in D is presented as mean ± SEM (*P < 0.05 versus control virus treated animals by t test).

