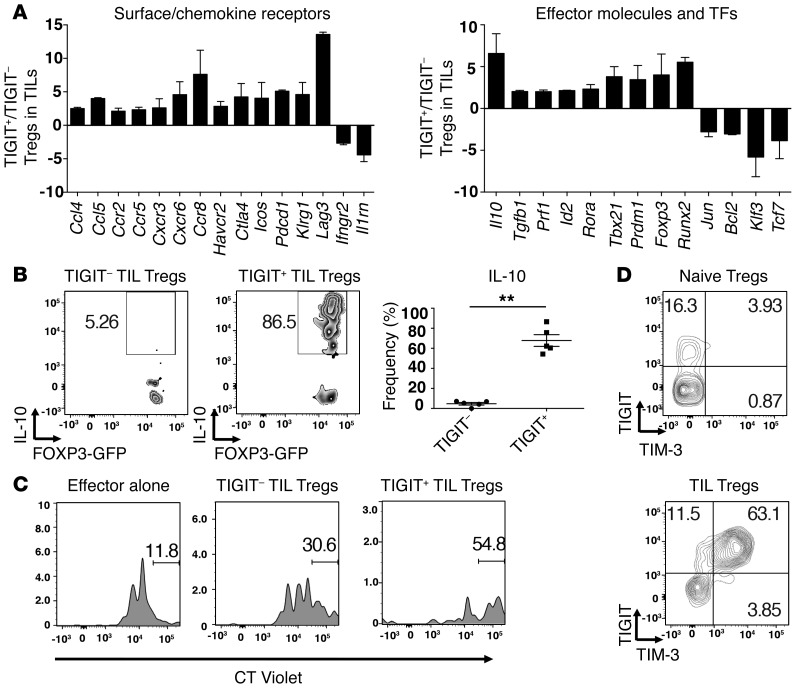
Figure 3. TIGIT+ Tregs in the tumor tissue exhibit a more suppressive and activated phenotype.
TIGIT+ and TIGIT– Tregs were isolated from B16F10 tumors implanted into Foxp3-GFP–KI mice (A, C, and D) or IL-10-Thy1.1 Foxp3-GFP–KI mice (B). (A) Gene expression was analyzed using a custom NanoString CodeSet. Bar graphs show the fold expression ± SEM of selected differentially expressed surface receptors (left), effector molecules, and transcription factors (TFs) (right) in TIGIT+ and TIGIT– Tregs. Data are pooled from 2 different experiments. Selected genes with a fold change of greater than 2 are depicted. (B) Left panels: representative flow cytometric data showing IL-10-Thy1.1 staining in TIGIT– and TIGIT+ Treg TILs. Right panel: frequency ± SEM of IL-10+ cells within TIGIT– and TIGIT+ Treg TILs (n = 5). Data are representative of 2 independent experiments. **P < 0.01 by Mann-Whitney U test. (C) Tregs isolated from tumor tissue were cocultured with splenic CT Violet–labeled CD4+ T cells (1:8). CT Violet dilution was analyzed by flow cytometry 4 days later. Gates indicate the undivided CD4+ subsets. Data are representative of 2 experiments. (D) Representative contour plots of TIM-3 expression on TIGIT+ TIL Tregs or TIGIT+ naive Tregs. Data are representative of 5 individual mice.

