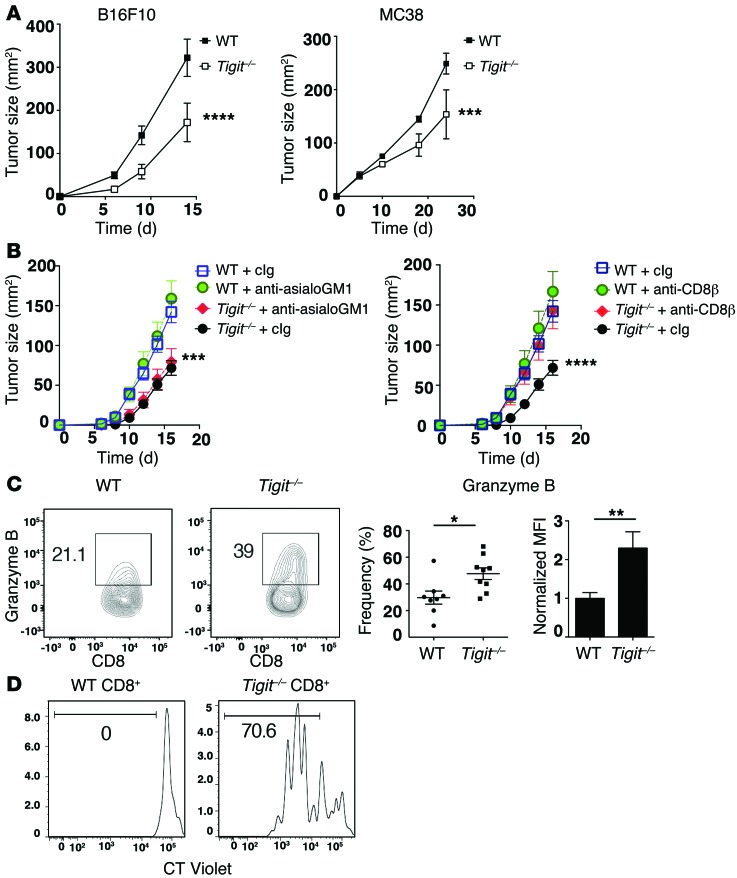
Figure 4. TIGIT restrains antitumor immune responses.
(A) Growth of B16F10 melanoma or MC38 colon carcinoma in WT or Tigit–/– mice (n = 5–6). Data are representative of 3 independent experiments. ***P < 0.001 and ****P < 0.0001 by repeated-measures ANOVA with a Sidak test. (B) WT or Tigit–/– mice (n = 5) were treated i.p. with anti-asialoGM1 or anti-CD8β Abs or with their isotype controls (cIg) on days –1, 0, 7, and 14 after B16F10 tumor implantation. Tumor growth after anti-asialoGM1 (left) or anti-CD8β (right) treatment is shown. Data are representative of 2 independent experiments. Comparisons are between WT plus cIg versus Tigit–/–, irrespective of cIg or anti-asialoGM1 treatment (left), and between cIg versus anti-CD8β in Tigit–/– mice (right). ***P < 0.001 and ****P < 0.0001 by repeated-measures ANOVA with a Sidak test. (C and D) Total TILs were isolated from B16F10 tumor–bearing WT or Tigit–/– mice (n = 4–5). (C) TILs were stimulated with 10 μg/ml gp100 peptide. Contour plots and bar graphs show the percentage ± SEM of granzyme B+ cells and the normalized MFI of granzyme B expression within CD8+ TILs. MFI was normalized to the mean of WT CD8+ TILs in each independent experiment. Data were pooled from 2 to 3 experiments. *P < 0.05 and **P < 0.01 by Mann-Whitney U test. (D) CT Violet–labeled TILs were stimulated with anti-CD3 for 4 days and then analyzed by flow cytometry. Representative histogram of CT Violet dilution in CD8+ TILs. Data are representative of 3 individual measurements.

