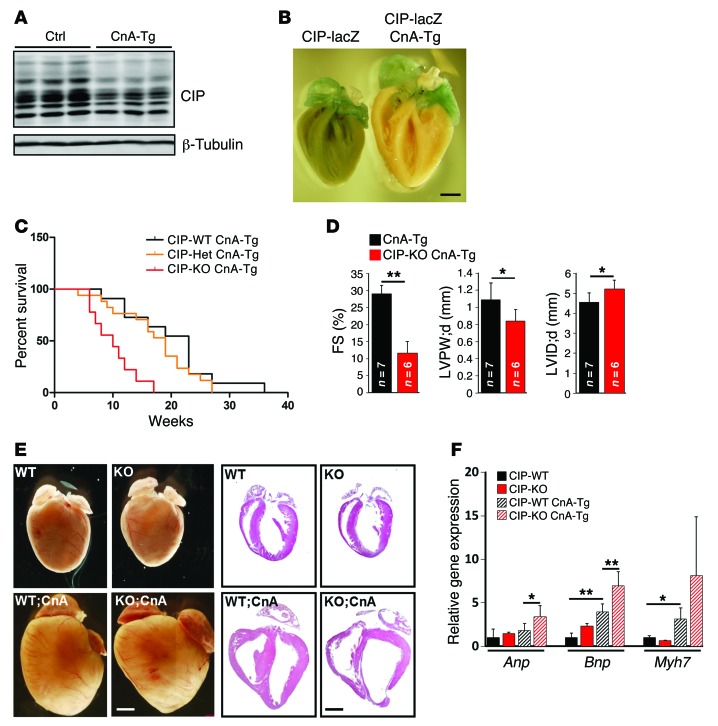
Figure 2. Genetic and functional interaction of CIP and calcineurin in cardiac hypertrophy.
(A) Western blot detection of the expression of CIP proteins in CnA-Tg and control hearts. β-Tubulin was used as a control. (B) β-Gal staining of the CIP reporter gene in CnA-Tg and control hearts. Scale bar: 1 mm. (C) Survival curve of CIP-KO CnA-Tg mice and their control littermates. The n number for each group is indicated. P < 0.01, CIP-WT CnA-Tg vs. CIP-KO CnA-Tg; P < 0.01, CIP-Het CnA-Tg vs. CIP-KO CnA-Tg, log-rank (Mantel-Cox) test. (D) FS of 10-week-old CIP-KO CnA-Tg mice and their control littermates. (E) Gross heart morphology and H&E staining of 6-week-old CIP-KO CnA-Tg mice and their control littermates. Scale bar: 1.2 mm. (F) qRT-PCR detection of the expression of hypertrophy marker genes in 3-week-old CIP-KO CnA-Tg and control hearts. n = 3–7 for each group. *P < 0.05, **P < 0.01, 1-way ANOVA with post-hoc Tukey’s test.

