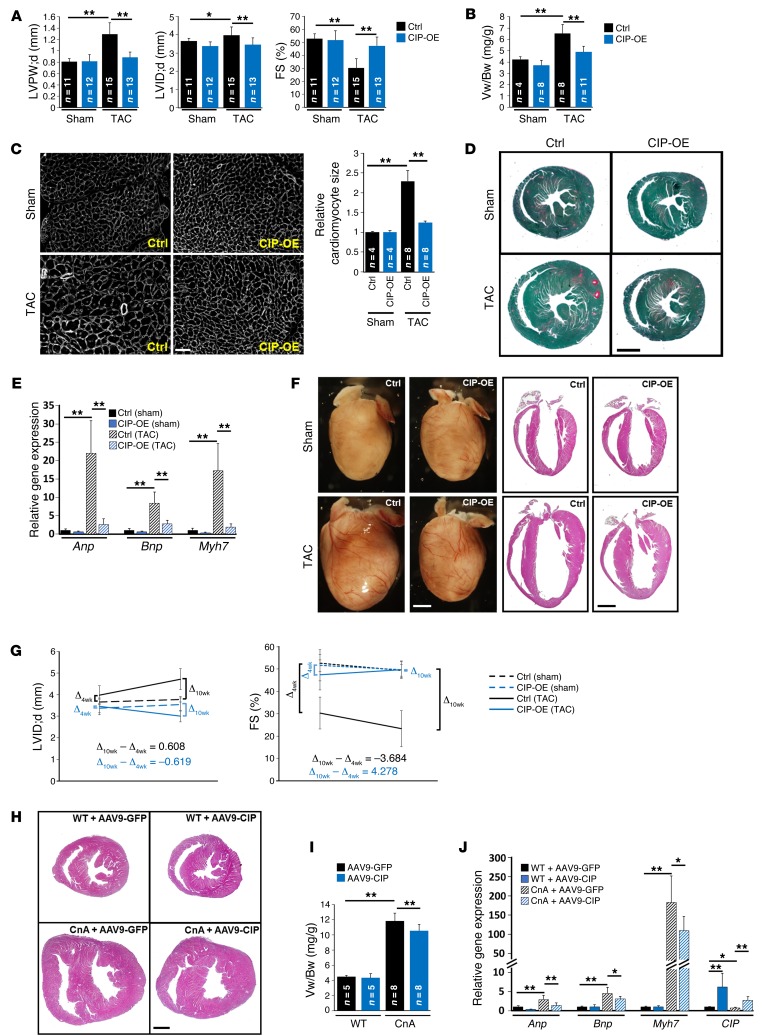
Figure 5. Gain of function of CIP protects the heart from mal-remodeling.
(A) LV posterior wall thickness at end-diastole, LV internal dimension at end-diastole, and FS of TAC- or sham-operated (4 weeks) CIP-OE and control mice. (B) The ventricle weight/body weight (Vw/Bw) ratio of CIP-OE and control hearts 4 weeks after TAC or sham operation. (C) Wheat germ agglutinin staining and cardiomyocyte cross-sectional area quantification of indicated hearts. Scale bar: 50 μm. (D) Fast green and Sirius red staining of CIP-OE and control hearts 4 weeks after TAC or sham operation. Scale bar: 1.5 mm. (E) qRT-PCR detection of the expression of hypertrophy marker genes in TAC- or sham-operated (4 weeks) CIP-OE and control hearts. n = 4–5 for each group. (F) Gross heart morphology and H&E staining of CIP-OE and control hearts 10 weeks after TAC or sham operation. Scale bar: 1.6 mm. (G) Dynamics of LV dimension and cardiac function 4 and 10 weeks after TAC or sham operation in CIP-OE and control mice. n = 8–15 for each group. (H) H&E staining of 4-week-old CnA-Tg and control mice injected with AAV9-CIP or control virus (AAV9-GFP). Scale bar: 1.5 mm. (I) Ventricle weight/body weight ratio of CnA-Tg and control mice injected with AAV9-CIP or control virus. (J) qRT-PCR detection of the expression of hypertrophy marker genes and CIP in CnA-Tg and control hearts with AAV9-CIP virus or control virus. n = 5–8 for each group. *P < 0.05, **P < 0.01, 1-way ANOVA with post-hoc Tukey’s test.

