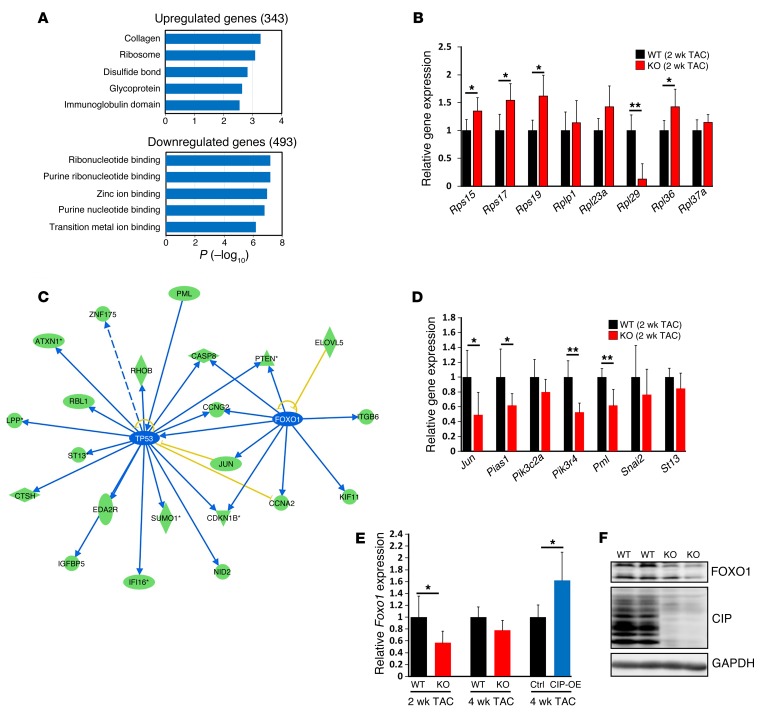
Figure 6. Signaling pathways that mediate CIP function in regulating cardiac homeostasis.
(A) Bioinformatic analysis of dysregulated genes (fold change >1.25) in CIP-KO and control hearts 2 weeks after TAC operation using DAVID (http://david.abcc.ncifcrf.gov/). (B) qRT-PCR validation of dysregulated genes in the “RIBOSOME” cluster. n = 5 for each group. (C) Ingenuity pathway analysis of the dysregulated genes in CIP-KO hearts 2 weeks after TAC operation. Green ovals indicate that gene expression in CIP-KO hearts is downregulated; blue lines indicate that the upstream gene expression leads to the inhibition of downstream gene expression; blue ovals indicate that gene expression in CIP-KO hearts is predicted to be inhibited; and yellow lines indicate that results are inconsistent with reported data. (D) qRT-PCR validation of dysregulated genes downstream of p53 and FOXO1. n = 5 for each group. (E) qRT-PCR validation of Foxo1 expression in CIP-KO and CIP-OE hearts under cardiac stress. n = 4–5 for each group. (F) Western blot detection of the expression of mouse FOXO1 proteins in CIP-KO and control hearts 2 weeks after TAC operation. GAPDH was used as a control. *P < 0.05, **P < 0.01, 1-way ANOVA with post-hoc Tukey’s test.

