
Figure 3. Large-molecule uptake in lacteals after physical and chemical damage of epithelial barrier.
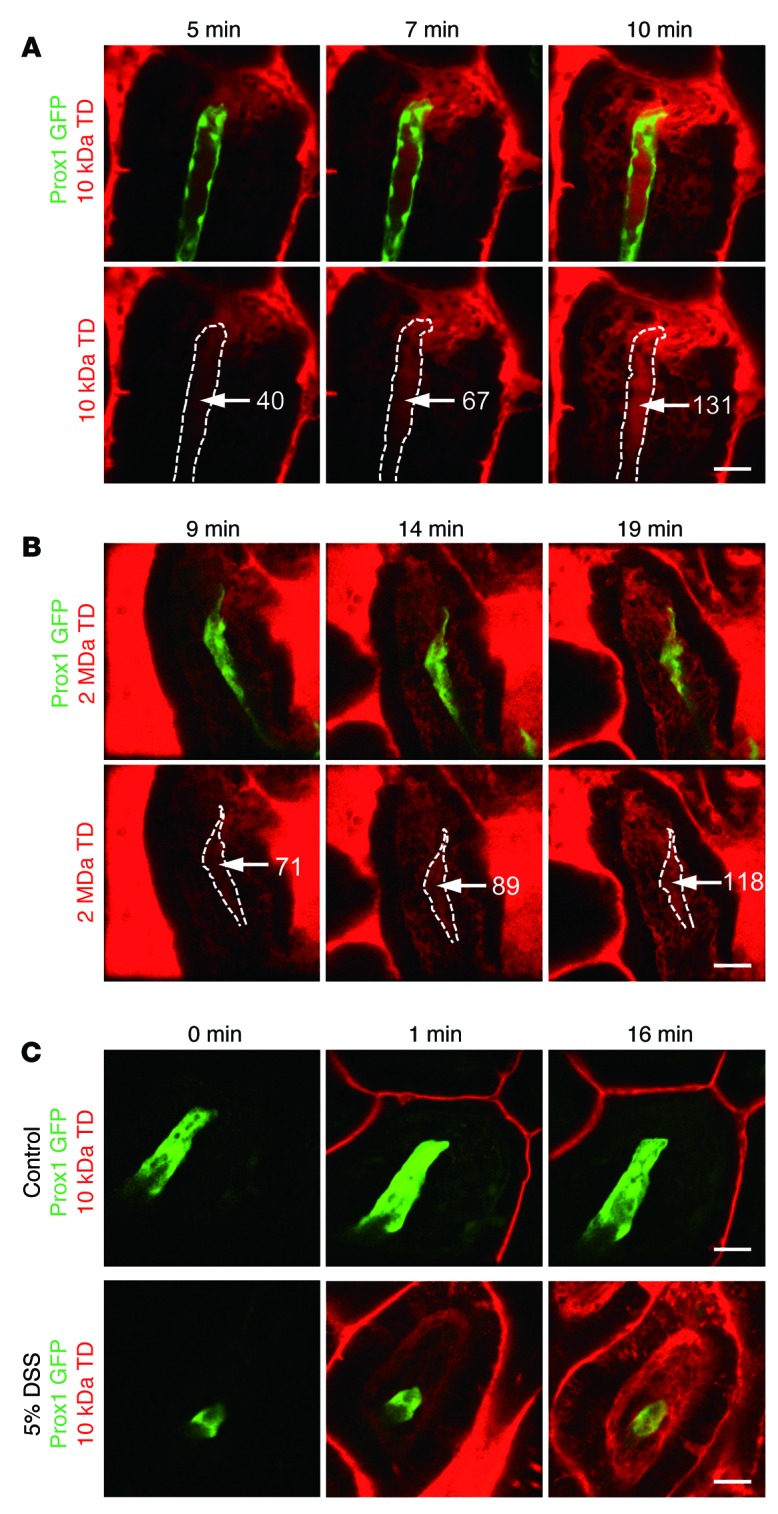
Time-lapse imaging of (A) 10-kDa and (B) 2-MDa TD uptake in lacteals after physical damage to the epithelial barrier by surgical tweezers. The fluorescent intensity of TD (white numbers) increases inside the lacteals (white dotted lines) over time after damage. (C) Representative images showing the drainage of 10-kDa TD in ileac villi of control mice and 5% DSS-induced inflammation model mice. Paracellular leakage of 10-kDa TD was shown in the inflammation model mice. Representative images were each obtained from more than 3 independent experiments. Scale bar: 30 μm.