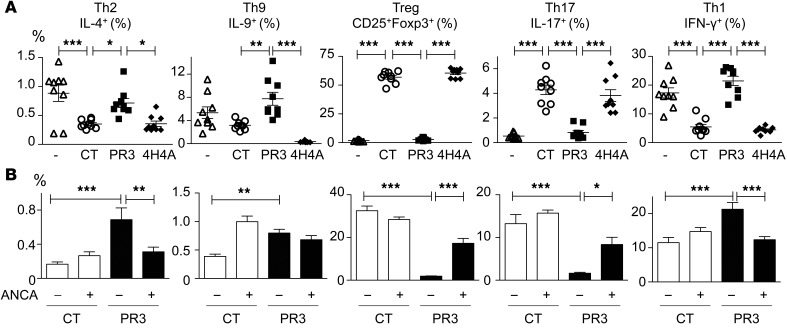
Figure 6. pDCs exposed in vivo to a PR3-induced microenvironment triggered the production of Th9 cells, and addition of anti-PR3 ANCA facilitated Th17 cell polarization.
(A) pDCs isolated from mice following the i.v. injection of vehicle (white triangles), apoptotic controls (white circles), PR3- (black squares), or PR3/4H4A-expressing cells (black diamonds) were cultured with naive CD25–CD4+ T cells from OTII/Rag1–/– mice in the presence of OVA peptide. Flow cytometry analysis was performed 4 days later, and the percentages of Tregs (CD4+CD25+FOXP3+), Th9 (CD4+IL-9+), Th2 (CD4+IL-4+), Th1 (CD4+IFN-γ+), and Th17 (CD4+IL-17A+) cells determined. (B) The above experiments were also performed with the concomitant injection of anti-PR3 ANCA or control IgG in the presence of apoptotic control (white bars) or PR3-expressing cells (black bars). T cell polarization was analyzed using flow cytometry. Data are presented as mean ± SEM. n = 3 mice per group, each mice studied in triplicate. Significant differences between groups were determined by ANOVA with multicomparison analysis. *P < 0.05; **P < 0.01; ***P < 0.001. The experiment presented in A was reproduced twice with identical results.

