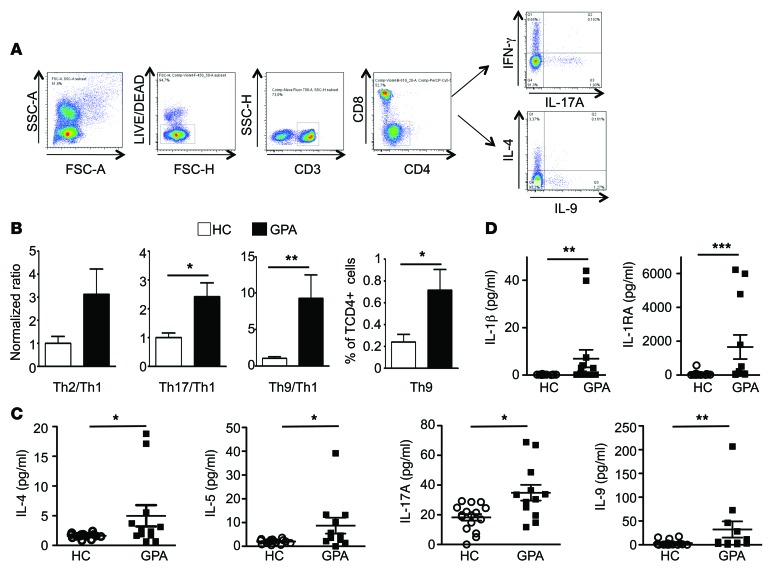
Figure 7. CD4+ T cells from GPA patients display a skewed Th9 cell distribution.
(A) Representative dot plots demonstrating the gating strategy used to identify Th1, Th2, Th17, and Th9 cells in human PBMCs. (B) The normalized ratio of Th2/Th1, Th17/Th1 and Th9/Th1 in circulating CD4+ T cells was determined in both healthy controls (white bars) and GPA patients (black bars). The percentages of Th9 cells were also calculated (n = 5 healthy controls and n = 6 GPA). (C and D) Sera from healthy controls (n = 16) and GPA patients (n = 12) were assessed for IL-4, IL-5, IL-17A, IL-9, and for IL-1β and IL-1RA using a Luminex assay. Data are presented as mean ± SEM. *P < 0.05; **P < 0.01; ***P < 0.001. Significant differences between groups were determined by multiple comparisons ANOVA (B–D).

