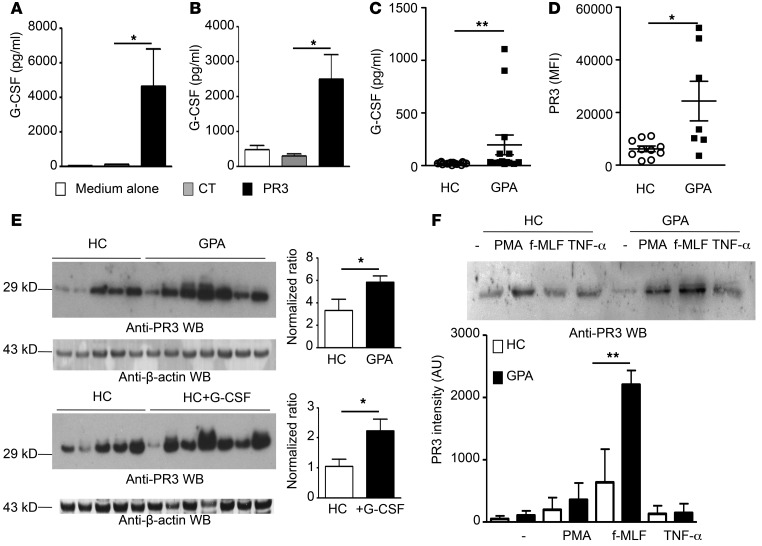
Figure 9. Increased G-CSF secretion by macrophages and T cells was associated with increased expression of PR3 in mature neutrophils.
(A) G-CSF concentrations in supernatants from macrophages 24 hours after exposure to medium alone (white bars), apoptotic control cells (gray bars), and PR3-expressing (black bars) cells or (B) G-CSF concentrations in supernatants from pDCs preexposed to the above macrophage supernatants and cocultured with T cells (n = 4 mice per group, each concentration was determined in triplicate). (C) G-CSF concentrations in sera from healthy controls (n = 16) and GPA patients (n = 14). (D) Intracellular content of PR3 in neutrophils from healthy controls (n = 11) or GPA patients (n = 9) determined by flow cytometry analysis. (E) Western blot analysis of PR3 expression in neutrophils from healthy controls (n = 5) and GPA patients (n = 7) (upper panel). Results were quantified by densitometry and normalized to β-actin loading control. Values represent mean ± SEM. Similarly, Western blot analysis (lower panel) was also performed on neutrophils from healthy controls (n = 5) and healthy controls treated with recombinant G-CSF (n = 7). Results were quantified as above. (F) Western blot analysis of PR3 in supernatants of neutrophils treated with PMA, TNF-α, or f-MLF. A representative experiment is shown in the upper panel. The quantification of PR3 by densitometry of all the Western blots performed (healthy controls, n = 4; GPA patients, n = 5) is shown in the lower panel. Values represent mean ± SEM. Significant differences between groups were determined by ANOVA (A and F) or Mann-Whitney U test (C–E). *P < 0.05; **P < 0.01.

