. 2015 Oct-Dec;6(4):222–224. doi: 10.4103/2229-3485.167092
Copyright: © 2015 Perspectives in Clinical Research
This is an open access article distributed under the terms of the Creative Commons Attribution-NonCommercial-ShareAlike 3.0 License, which allows others to remix, tweak, and build upon the work non-commercially, as long as the author is credited and the new creations are licensed under the identical terms.
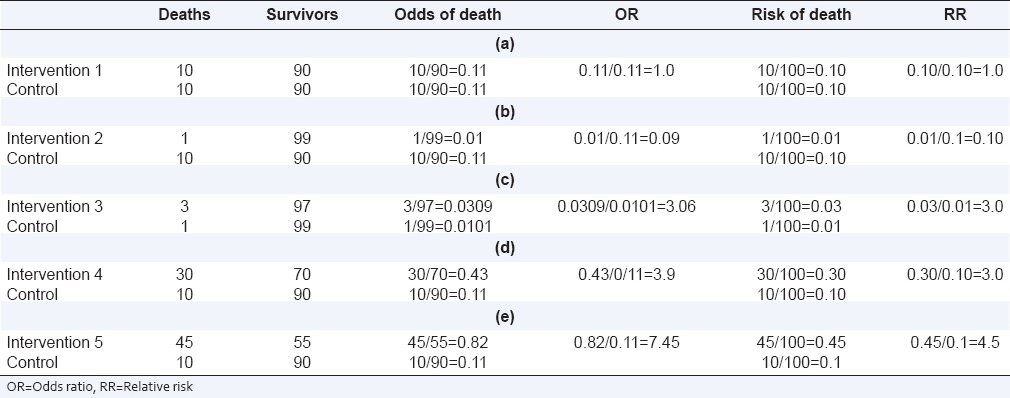
Table 3.
RR and OR for different event rates