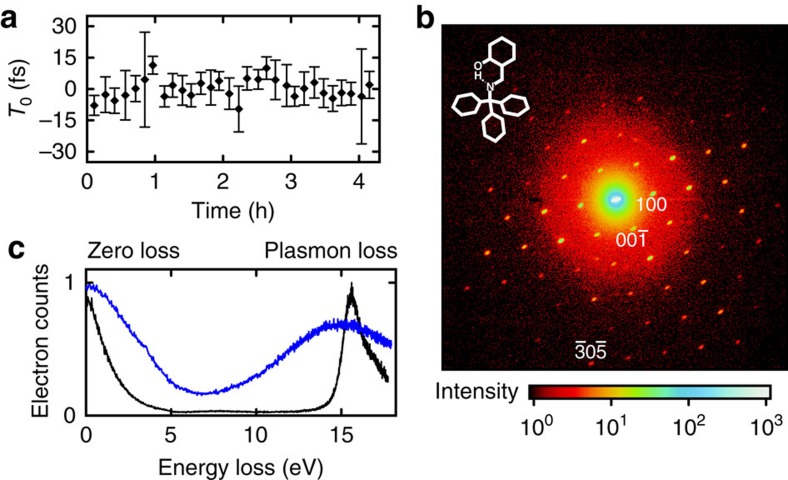
Figure 6. Diffraction and spectroscopy with compressed electron pulses.
(a) Repeated laser-electron streaking measurements reveal a superior long-term stability of T0, the coincidence of laser pulses and electron pulses in time. The error bars are s.e.'s of the streaking spectrograms' time-zero fits. (b) Static diffraction pattern obtained with compressed electron pulses (28 fs FWHM) focused on a molecular crystal with unit cell dimensions of 1 nm. The measured intensities and sharpness of the spots demonstrate the ability to achieve atomic-scale resolution with compressed single-electron pulses. (c) Electron energy loss spectroscopy (EELS) of aluminium obtained with uncompressed (black) and compressed (blue) single-electron pulses. Although the compressed pulses (blue) are broadend according to Fig. 1, the plasmonic loss peak at ∼17 eV, representing the bulk metal's plasma frequency, is clearly distinguishable from the zero-loss peak in both cases (370- and 28-fs FWHM duration, respectively).

