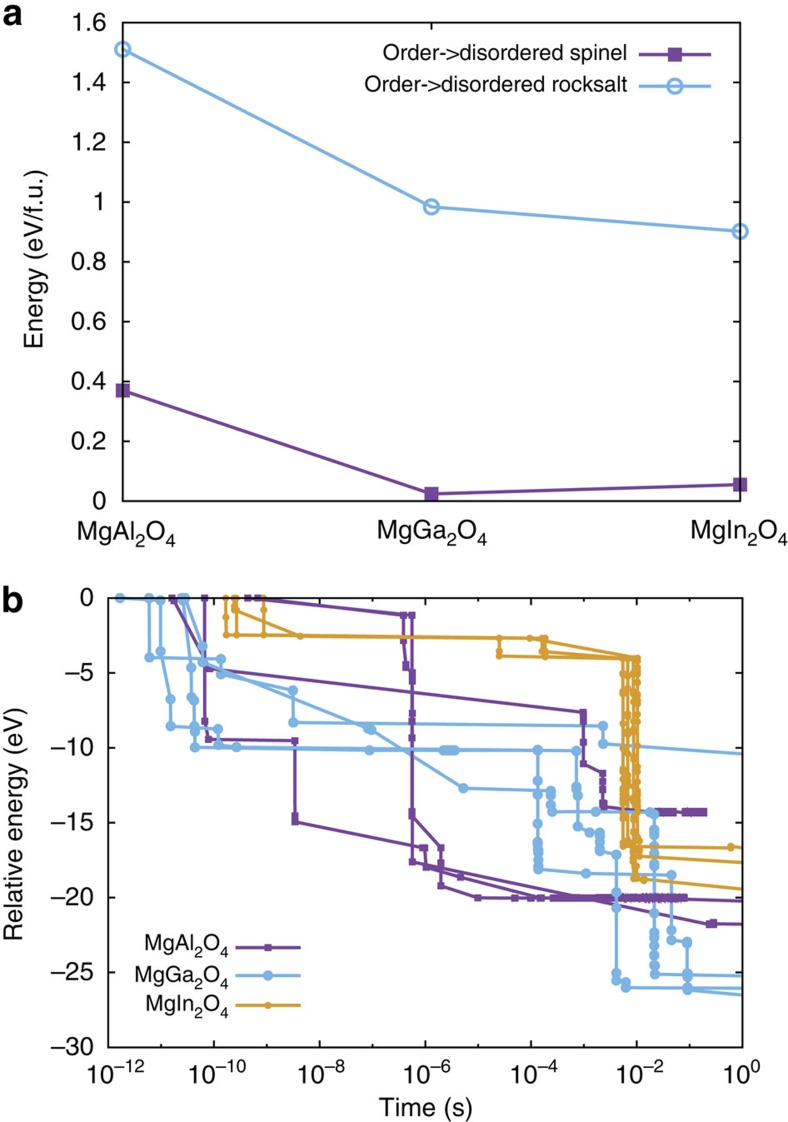
Figure 3. Thermodynamic and kinetic behaviour in spinels.
(a) Relative energy, in eV per formula unit, of disordered spinel (purple curve/filled symbols) and defective rocksalt (blue curve/open symbols) for MgAl2O4, MgGa2O4 and MgIn2O4, as calculated using SQS and DFT. The energetics of the ordered spinel to disordered spinel transformation do not completely track the amorphization susceptibility observed in the experiments. The energetics of disordering all the way to rocksalt follow the same trend as the experiments. (b) TAD simulations showing the evolution of MgAl2O4 (purple curve/squares), MgGa2O4 (blue curve/open circles) and MgIn2O4 (yellow curve/filled circles), initially placed in a defective rocksalt structure. The zero of energy is the initial defective rocksalt structure, in which the atomic positions are minimized but the cell dimensions are held at those for ordered spinel. For each compound, four different simulations, starting from the same structure but evolved with different random number seeds, are shown. The points represent transitions between states that occur at the indicated times. The lines are guides for the eye. There is a general trend that relaxation is fastest for MgAl2O4 and slowest for MgIn2O4.

