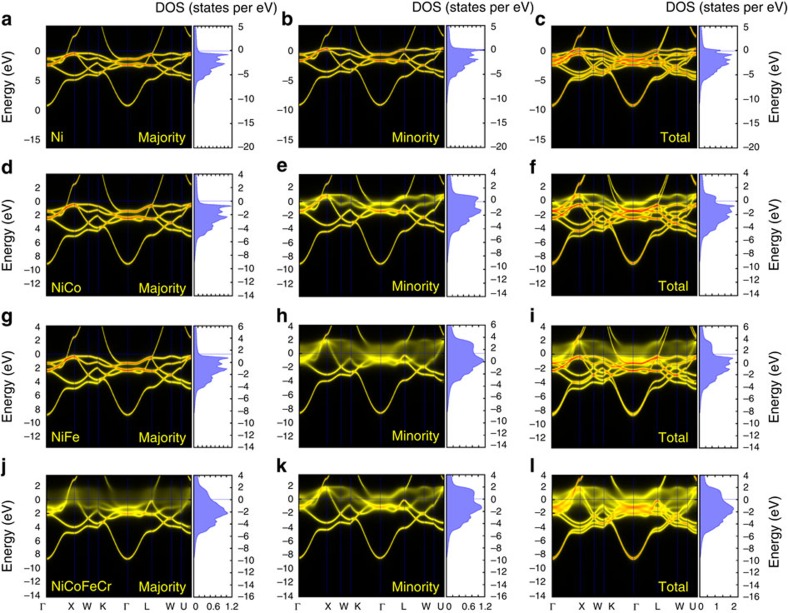
Figure 1. Electronic structure calculated using KKR-CPA method.
Bloch spectral density function along high-symmetry directions and density of states of (a–c) nickel, (d–f) NiCo, (g–i) NiFe and (j–l) NiCoFeCr. Each of the 12 plots shows the disorder broadening of the electronic structure as encapsulated in the Bloch spectral function (left of panels) and the corresponding densities of states (right of panels). a,d,g,j and b,e,h,k show the majority (spin up) and minority (spin down) BSF and DOS, while c,f,i,l show the corresponding total BSF and DOS. The DOS is plotted in units of states per eV per atom.

