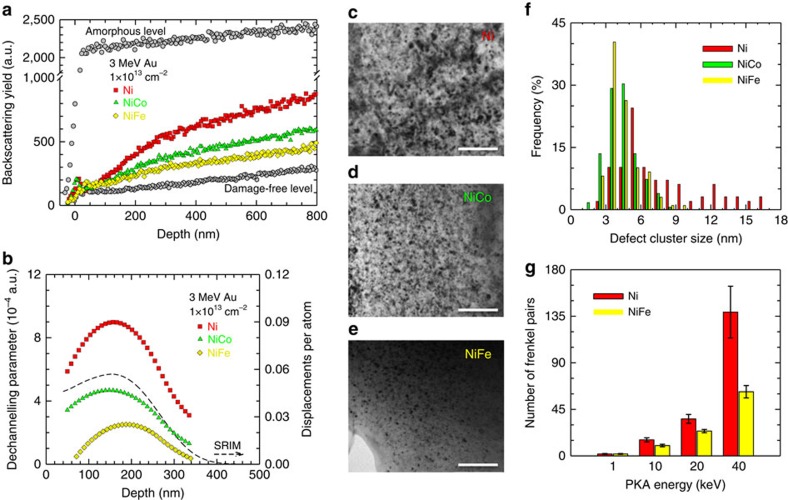
Figure 3. Response to ion energy deposition.
(a) Rutherford backscattering spectra along (001) direction. Both random and virgin spectra are included to indicate the damage-free level before irradiation and a full amorphous level where no crystallinity exists. (b) Ion irradiation-induced damage distribution determined from the ion channelling spectra in a and damage profile in nickel predicted using the Kinchon–Pease damage calculation model in the SRIM code. Compared with pure nickel, improved irradiation resistance is observed under 3 MeV Au to fluence of 1 × 1013 cm−2 in the binary alloys, with NiFe outperforming NiCo. Microstructural characterization was performed where bright-field images were taken from the damage peak region of (c) nickel, (d) NiCo and (e) NiFe samples irradiated using 3 MeV Au ions to a fluence of 2 × 1013 cm−2, scale bars 40 nm. The size distribution of defect clusters is summarized in (f). A comparison of the number of Frenkel pairs produced in nickel and NiFe is shown in (g). Ion–solid interactions are stochastic; primary knock-on atoms (PKA) with the same initial energy may result in different number of defects. The corresponding uncertainty is provided as the error bars based on the statistics from the displacement cascade simulations.

