
Fig. 4.
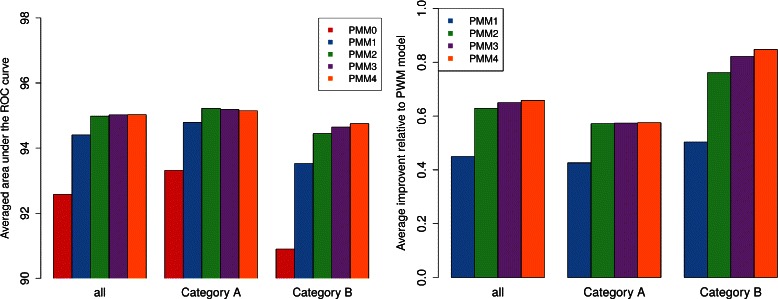
Aggregated results of fragment-based classification. The left figure shows the AUC for different models in percent averaged over (i) all ten cross-validation iterations for each data set as well as (ii) over all data sets and subgroups thereof. Right figure shows the relative improvement of PMMs of different order in relation to the PWM model according to the Ψ d as defined in Eq. 1, which is also averaged (i) over all cross-validation iterations for each data set as well as (ii) over all data sets and subgroups thereof