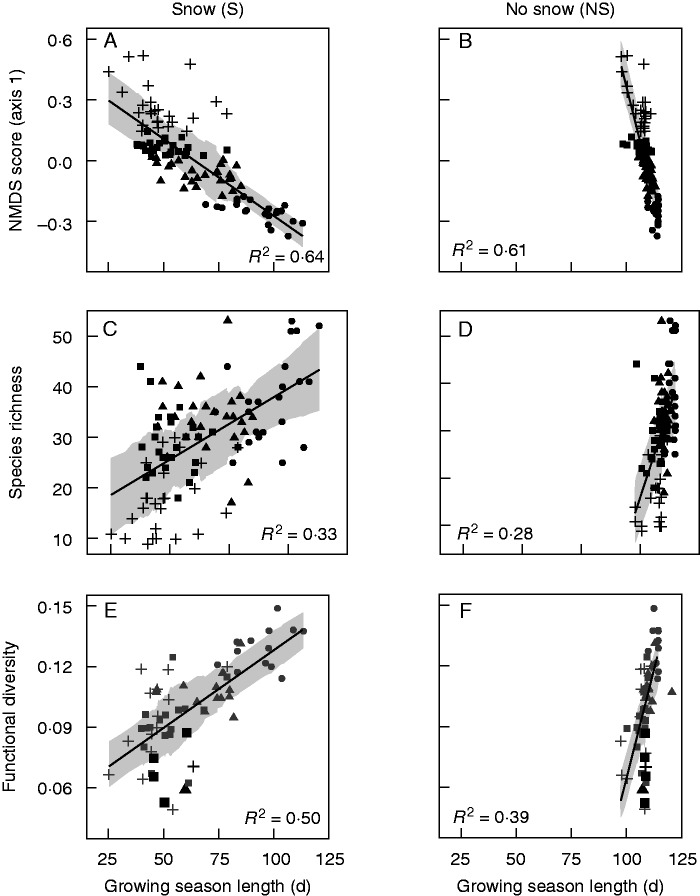
Fig. 3.
First-axis NMDS score (A, B), species richness (C, D) and functional diversity (E, F) plotted relative to growing season length estimated with (left) and without (right) snow cover. Point symbols correspond to quartiles of the NMDS score. Black points in (E) and (F) represent significant functional convergence. Shaded ribbons correspond to the linear model ± the running mean absolute error (k = 25).

