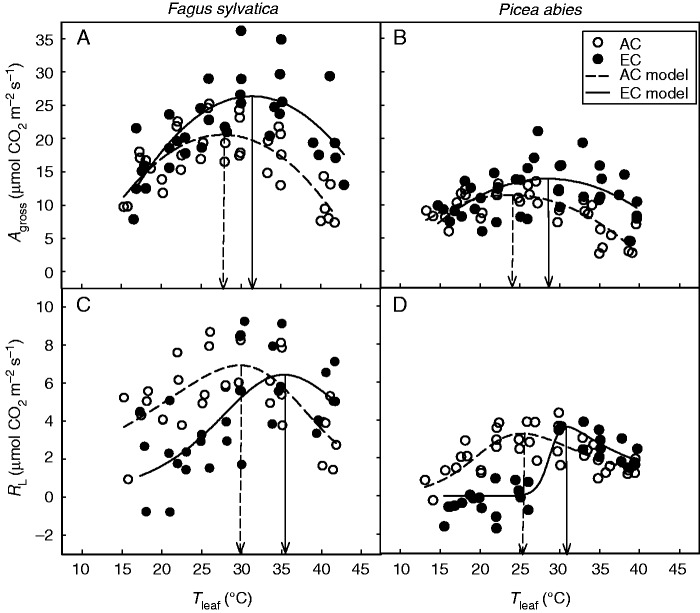
Fig. 4.
Temperature response curves of light-saturated rate of gross CO2 assimilation (Agross; A, B) and photorespiration (RL; C, D) in Fagus sylvatica (A, C) and Picea abies (B, D) grown under ambient (AC) and elevated (EC) atmospheric CO2 concentration. Gas-exchange measurements were made at growth CO2 concentration and 2 % O2 in the atmosphere. The parabolic function (eqn 1) and modified Arrhenius function (eqn 2) were fitted to the Agross (R2 = 0·38–0·65; P < 0·01) and RL (R2 = 0·42–0·84; P < 0·01) data, respectively. Individual measured values are shown. The vertical lines indicate modelled temperature optima of VCmax for AC and EC trees.

