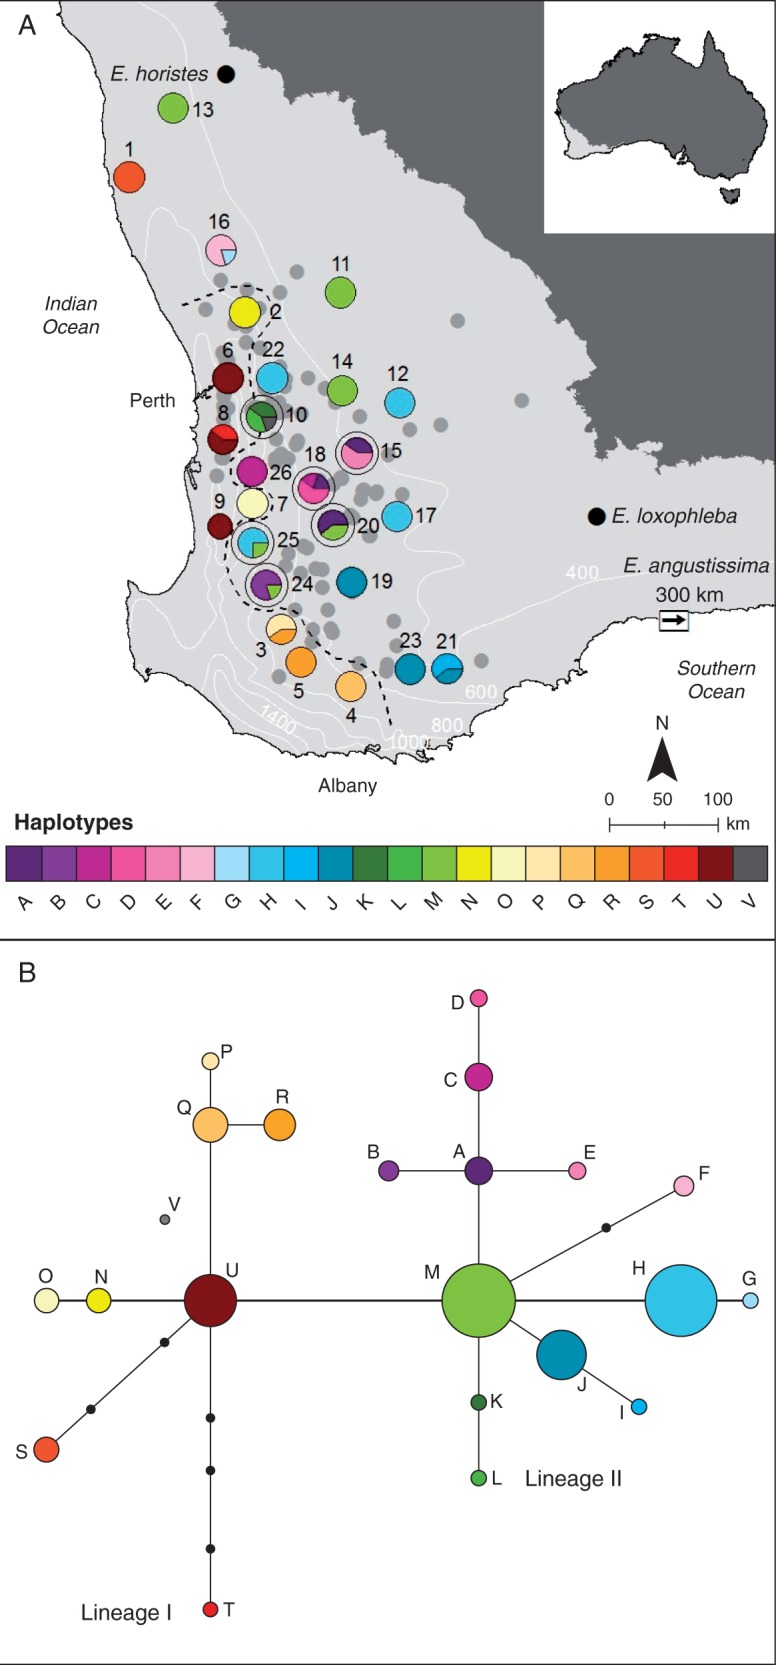
Fig. 1.

Location of the sampled populations of Eucalyptus wandoo in south-western Australia and their haplotype composition. (A) Sampled populations of E. wandoo are represented with large circles that are coloured according to their haplotype composition. Populations with high haplotype diversity within the refugium area are marked with an outer circle. Species records obtained from NatureMap are represented by light grey circles. Locations of the outgroup species samples are represented with black dots (except for E. angustissima, which is located 300 km east from the arrow, on the coast). The dashed line represents the phylogeographic break between the two lineages. Rainfall isohyets lines (200 mm) are represented in white. (B) Haplotype network for E. wandoo. Haplotypes are identified with the letters A–V, according to Table 2. Interior haplotypes not detected in the samples are represented by small black circles. Each line represents a single polymorphism.
