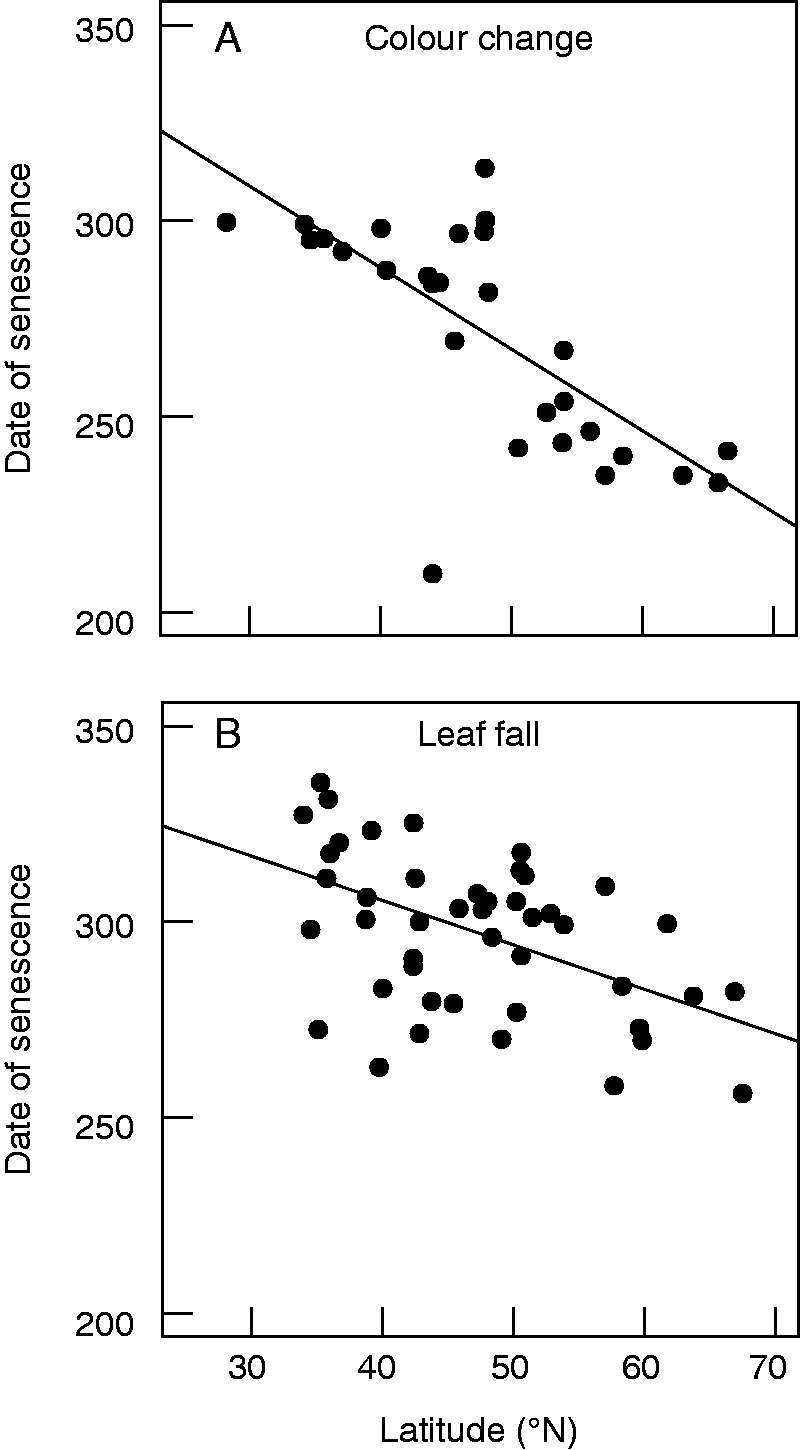
Fig. 2.

Relationship between latitude and the date of leaf senescence by studies that estimate date of senescence using (A) leaf colour change and (B) percentage leaf fall. Points represent all studies that estimate the date of leaf senescence using either method. Measurements using leaf colour change explain more variation in the relationship between latitude and the date of leaf senescence than measurements using percentage leaf fall (colour change, R2 = 0·55, P < 0·001; leaf fall, R2 = 0·26, P < 0·001).
