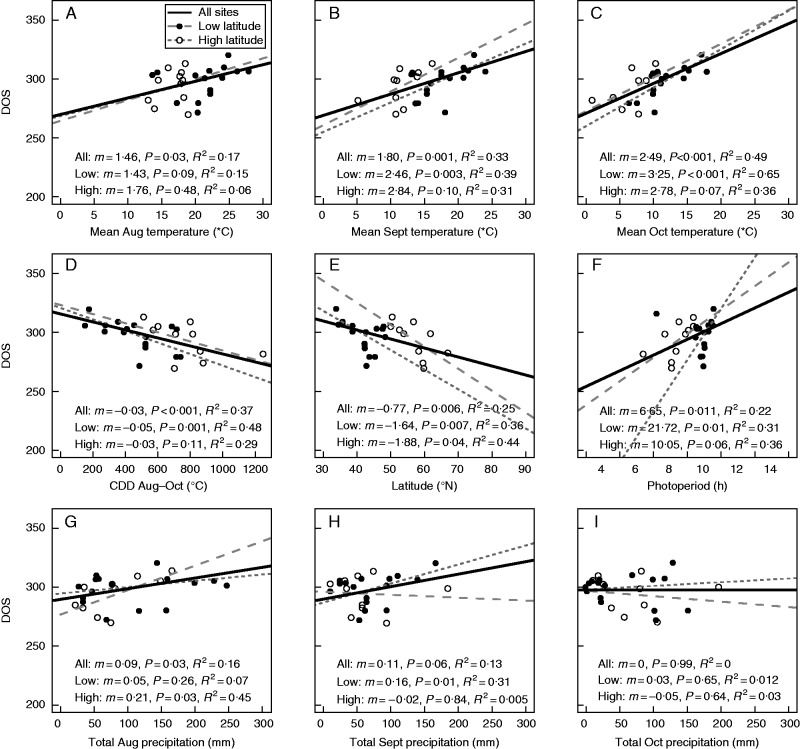
Fig. 3.
Relationship between monthly averaged site temperature (°C), cooling degree-days (CDDs, °C), photoperiod (h) on date of senescence (DOS), site latitude, total monthly precipitation (mm) and the date of 50 % leaf fall. Points represent the average date of 50 % leaf fall by site. Low-latitude and high-latitude sites are as indicated in the key in (A).

