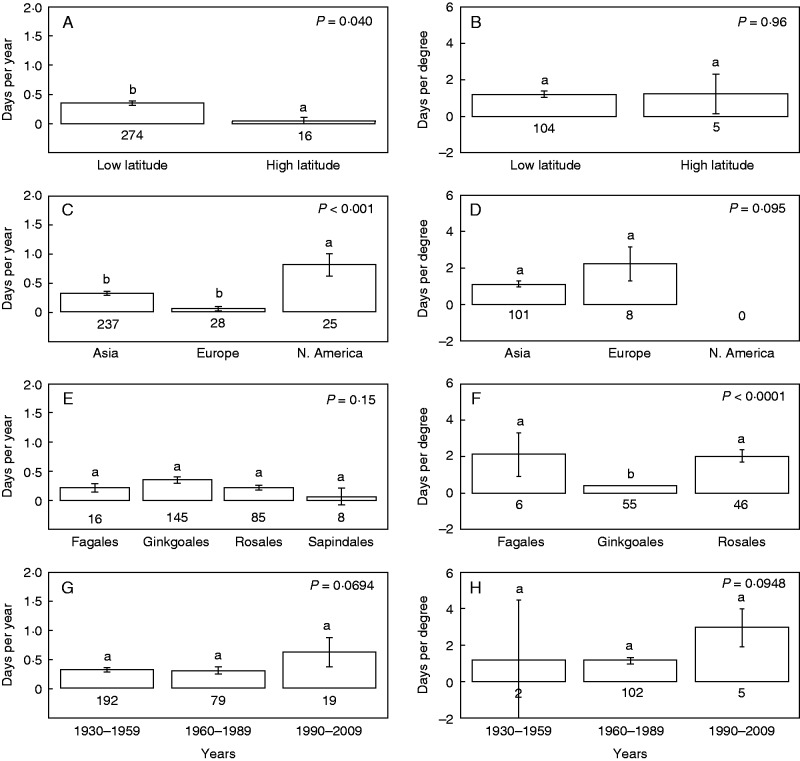
Fig. 4.
Change in date of senescence by latitude range, continent, plant order and decade. Shown are orders with more than five independent observations. Time periods in (G) and (H) show the decade in which senescence observations began, with all studies ending between 1993 and 2010. Values are means ± s.e.; different letters indicate statistically significant differences between groups. Values below the bars show the number of independent observations.

