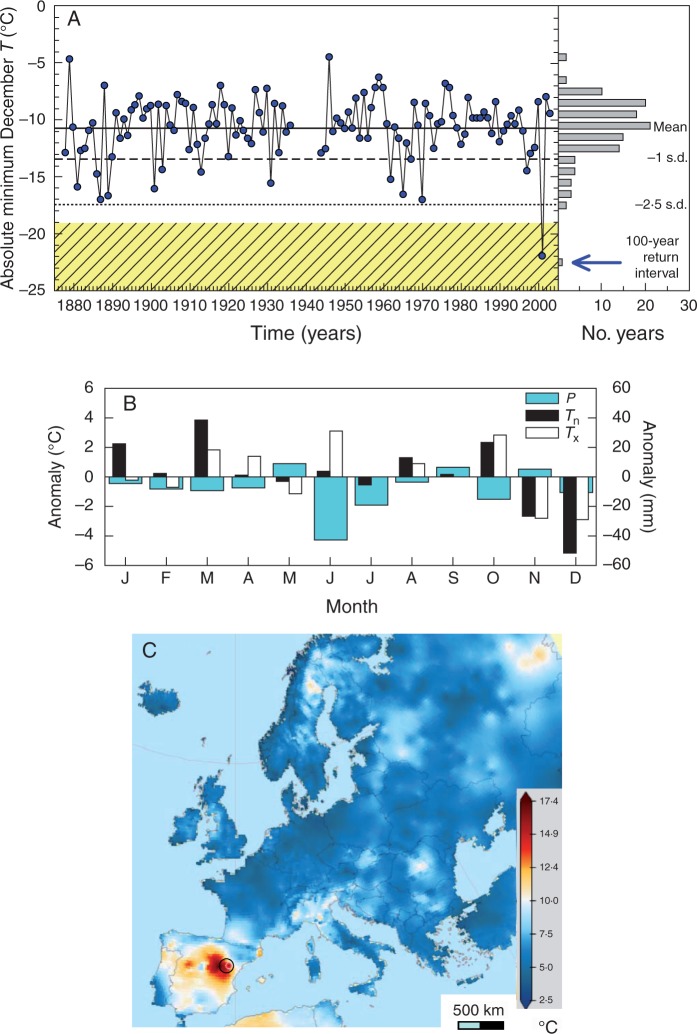
Fig. 2.
Temporal (A, B) and spatial (C) contexts defined for the extreme December 2001 cold event which caused dieback in Scots pine (Pinus sylvestris) forests in eastern Spain. The uppermost plot shows the absolute minimum temperatures recorded in Teruel station (note the gap in the 1930s to 1940s) with its distribution and mean, standard deviation (s.d.) and estimated 100 year return interval (hatched area). The middle plot shows the 2001 monthly anomalies with respect to the 1961–1990 average for precipitation (P) and mean minimum (Tn) and maximum (Tx) temperatures. In the lowermost plot, the gridded December 2001 diurnal temperature range is shown across Europe (the circle indicates the study area). The map was built using the E-OBS gridded climate data set (Haylock et al., 2008).

