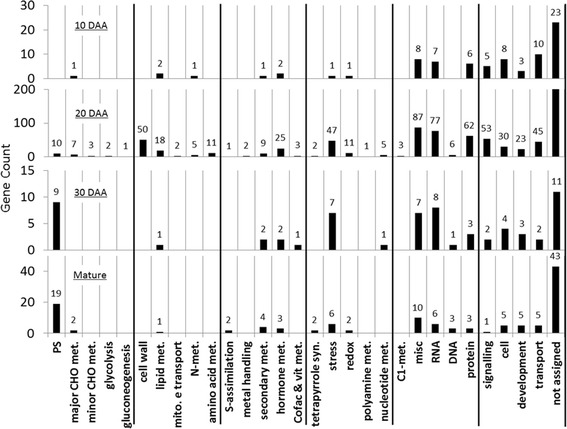
Fig. 5.

Cellular processes affected by CmOr. Gene counts according to their MapMan bin-code name of cellular processes. Each bar represents the number of DEGs between the ‘green’ and the ‘orange’ bulks at (from top to bottom) 10, 20 and 30 DAA and at mature fruit stages. An adjusted P value of 0.01 was used to detect DEGs at 10, 20 DAA and the mature fruit stages, while for 30 DAA we used an adjusted P value of 0.05. PS = Photosynthesis; CHO = carbohydrates; met = metabolism; syn = Synthesis; mito. E transport = mitochondrial electron transport; cofac & vit = cofactors and vitamins; C1 = one carbon
