
Figure 2.
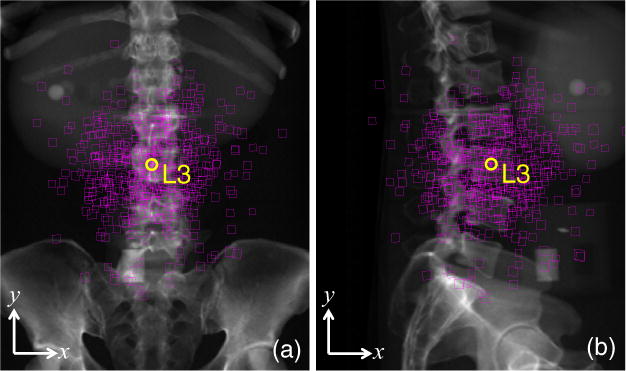
Illustration of the distribution in initialization errors in the simulation study superimposed on (a) PA and (b) LAT radiographs. Each square indicates one initial pose estimate of the L3 vertebra (with the true position shown as a yellow circle). Close inspection of the corners of each square shows not only the error in (x, y) placement but also a skew imparted by rotational errors in the initialization.