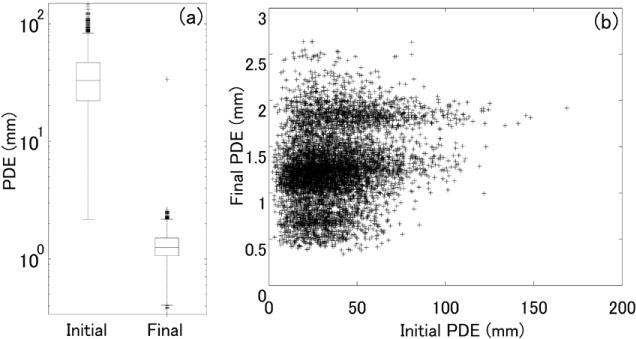
Figure 6.

Robustness evaluation in 9000 random trials with real images from the cadaver study. (a) Initial and final PDE. Box and whisker plots denote the first/third quartiles and min/max values, respectively, with the median marked by the horizontal line and outliers by crosses. (b) Scatter plot of the final PDE as a function of the initial PDE.
