
Fig. 3.
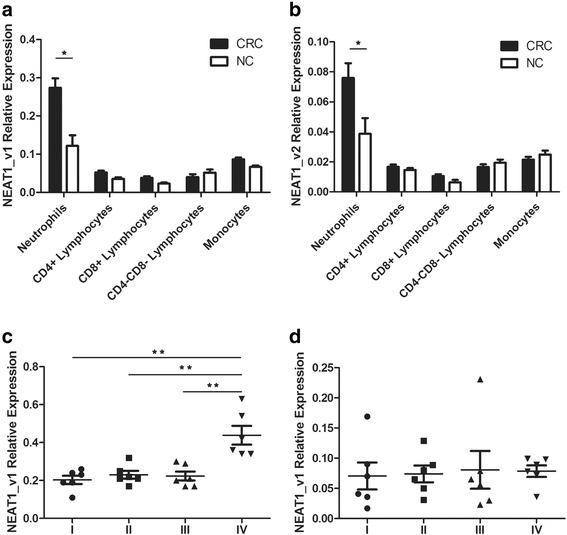
Different expression of NEAT1 isoforms in 5 groups of immune cells sorted from peripheral blood. (a) The NEAT1_v1 expression was different in five groups of immune cells, and varied dramatically in neutrophils from two groups of people (p = 0.018). (b) The NEAT1_v2 expression in CRC patients was also higher than that in normal controls (p = 0.0057). All graphs showed mean values ± SEM. *p < 0.05. (c) NEAT1_v1 was higher in neutrophils fro stage IV colorectal cancer patients. (d) No significant difference was detected in NEAT1_v2 expression in different stage