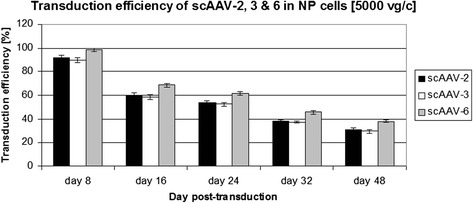
Fig. 2.

FACS based transduction efficiencies of scAAV2, scAAV3 and scAAV6 in NP cells. 1 x 10⁵ NP cells were seeded and after transduction at a viral dose of 5000 vg/c, GFP positive cells were quantified by FACS on day 8, 16, 24, 32 and 48 of post-transduction. Data represent the mean with standard deviation (SD) of three independent experiments, each performed in triplicate (p < 0.05). Error bars indicate SD values
