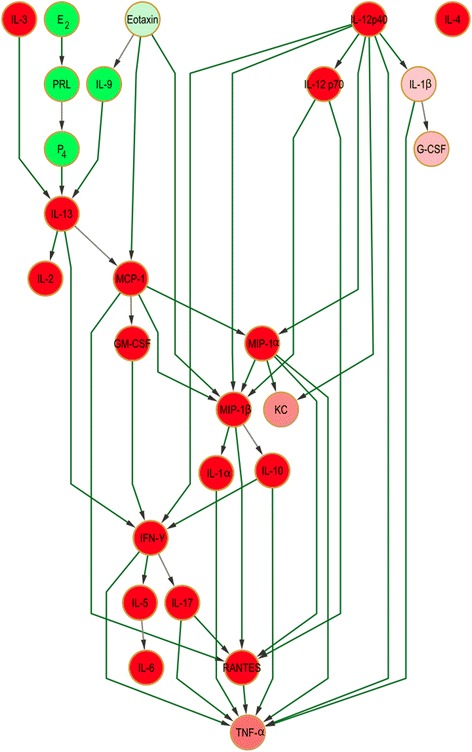
Fig. 4.

Bayesian network showing cytokine interrelationships in murine lactation. The nodes are color-coded according to the conditional probability of corresponding mediator relative concentrations being high (green), low (red) or medium (white) concentration given the state(s) of their parent nodes; however, within the present network no nodes fell into the medium category. Relative to the white color, the normalized concentration (low or high) determines the intensity of the node color. Very high confidence level edges (causal connecting lines between nodes) are colored in green (or grey if lower than the 0.9 cutoff), based upon the confidence analysis of the Bayesian result
