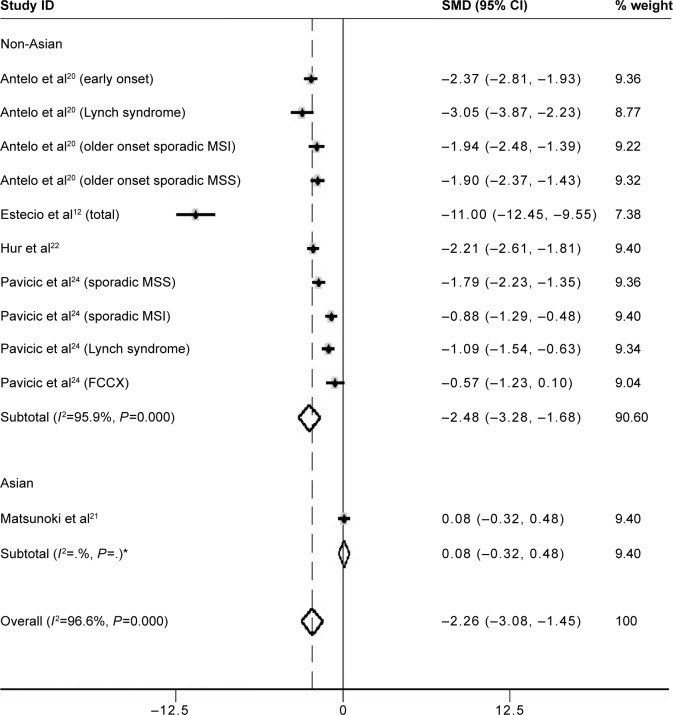
Figure 2.
Forest plot of the SMD of LINE-1 methylation levels between colorectal cancer and control groups.
Note: The subgroup analysis was based on ethnicity. Weights are from random effects analysis. *There is only one study in the Asian subgroup, so the I2 of the subgroup is blank in the output graph.
Abbreviations: FCCX, familial colorectal cancer type X; MSI, microsatellite instability; MSS, microsatellite stability; LINE-1, long interspersed element-1; SMD, standardized mean difference; CI, confidence interval.

