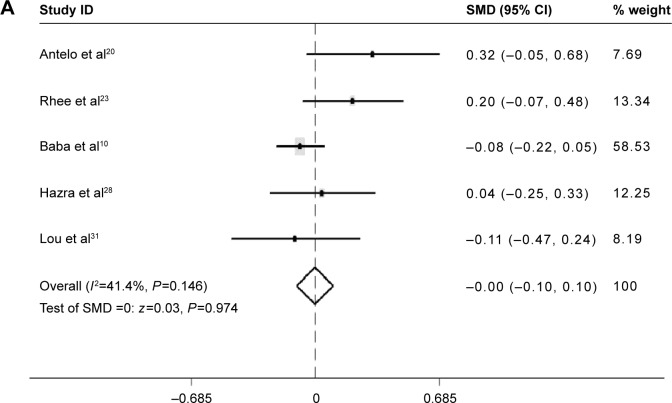
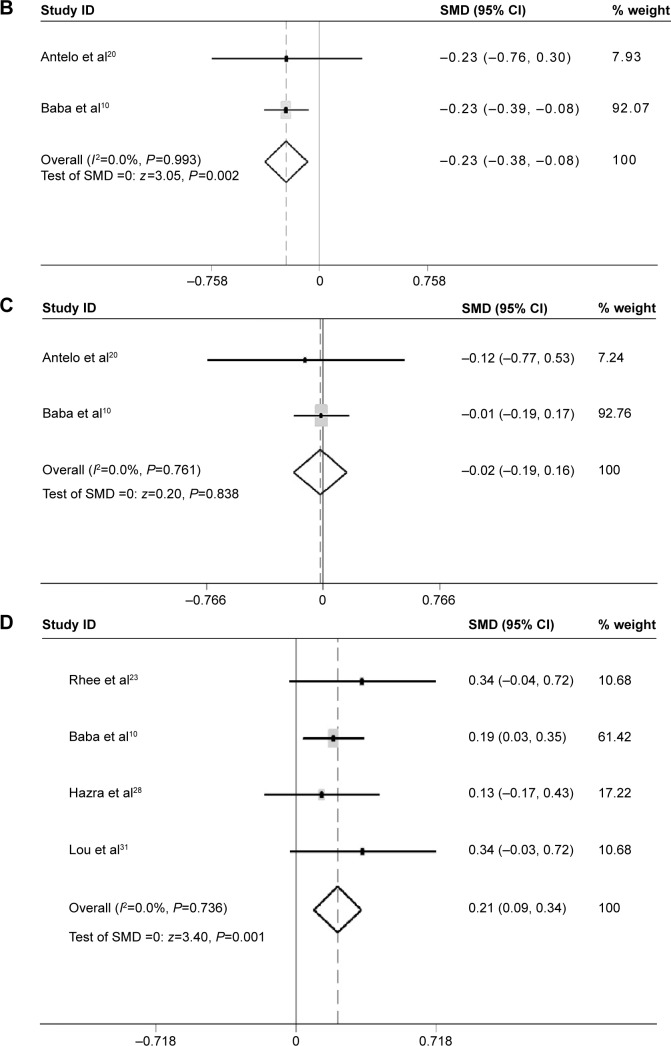
Figure 6.
Forest plot of the SMD of LINE-1 methylation levels between several clinical features in CRC.
Notes: (A) Forest plot of the SMD of LINE-1 methylation levels between males and females. (B) Forest plot of the SMD of LINE-1 methylation levels between patients with and without a family history. (C) Forest plot of the SMD of LINE-1 methylation levels between patients with BMI values below 30 and above 30. (D) Forest plot of the SMD of LINE-1 methylation levels between patients with right colon cancer and left colon cancer.
Abbreviations: BMI, body mass index; CI, confidence interval; CRC, colorectal cancer; LINE-1, long interspersed element-1; SMD, standardized mean difference.


