. 2015 Nov 9;6:24. doi: 10.1186/s13293-015-0043-9
© Block et al. 2015
Open AccessThis article is distributed under the terms of the Creative Commons Attribution 4.0 International License (http://creativecommons.org/licenses/by/4.0/), which permits unrestricted use, distribution, and reproduction in any medium, provided you give appropriate credit to the original author(s) and the source, provide a link to the Creative Commons license, and indicate if changes were made. The Creative Commons Public Domain Dedication waiver (http://creativecommons.org/publicdomain/zero/1.0/) applies to the data made available in this article, unless otherwise stated.
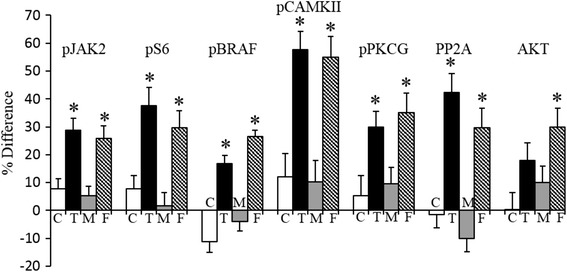
Fig. 4.

Sex and genotype differences in levels of selected proteins in cortex. Legend as in Fig. 2
