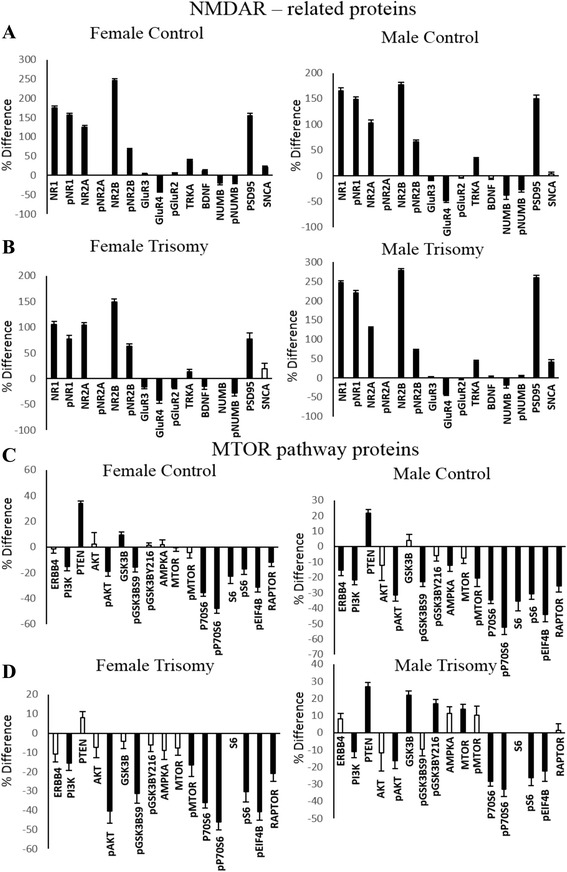
Fig. 5.

Ratio of protein levels in hippocampus and cerebellum. a NMDAR subunits and related proteins in female and male control mice. b NMDAR subunits and related proteins in female and male Dp10 mice. c Components of the MTOR pathway in female and male control mice. d Components of the MTOR pathway in female and male Dp10 mice. Y axis % difference in hippocampus vs. cerebellum. Black bars significant difference, white bars non-significant difference
